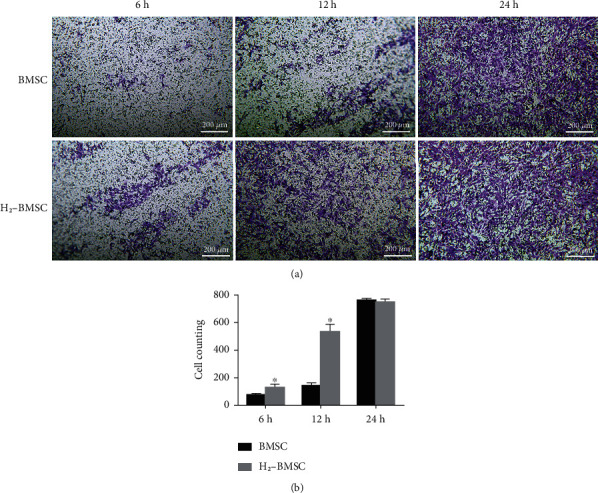
Figure 3.

H2 promotes the migration ability of BMSCs. (a) shows the cell migration in the BMSC and H2-BMSC groups at 6 h (73.20 ± 10.43 vs. 158.60 ± 22.11), 12 h (140.60 ± 22.69 vs. 533.20 ± 53.68), and 24 h (761.80 ± 13.27 vs. 747.80 ± 24.03). (b) shows the number of migrated BMSC in the two groups at different times. Data as the mean ± SD. ∗P < 0.05 vs. BMSC group (n = 6).
