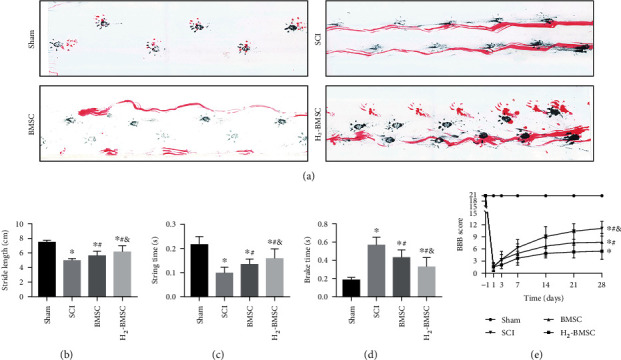
Figure 5.

H2 enhances the effect of BMSC transplantation in the treatment of motor function after SCI. (a) shows footprint and walking images of each group 28 days after SCI (blue ink: forelimb prints; red: hindlimb prints). (b–d) show the quantitative analysis of stride length, brake time, and stride time of each group 28 days after SCI. (e) shows the BBB score performed 1 d before surgery and 1 d, 3 d, 7 d, 14 d, 21 d, and 28 d after surgery. Data as mean ± SD. ∗P < 0.05 vs. the sham group. #P < 0.05 vs. the SCI group. &P < 0.05 vs. the BMSC group (n = 10).
