Figure 8.

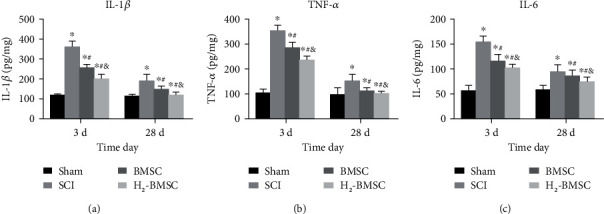
Determining the content of IL-1β (a), TNF-α (b), and IL-6 (c) via ELISA. Data as mean ± SD. ∗P < 0.05 vs. the sham group. #P < 0.05 vs. the SCI group. &P < 0.05 vs. the BMSC group (n = 5).

Determining the content of IL-1β (a), TNF-α (b), and IL-6 (c) via ELISA. Data as mean ± SD. ∗P < 0.05 vs. the sham group. #P < 0.05 vs. the SCI group. &P < 0.05 vs. the BMSC group (n = 5).