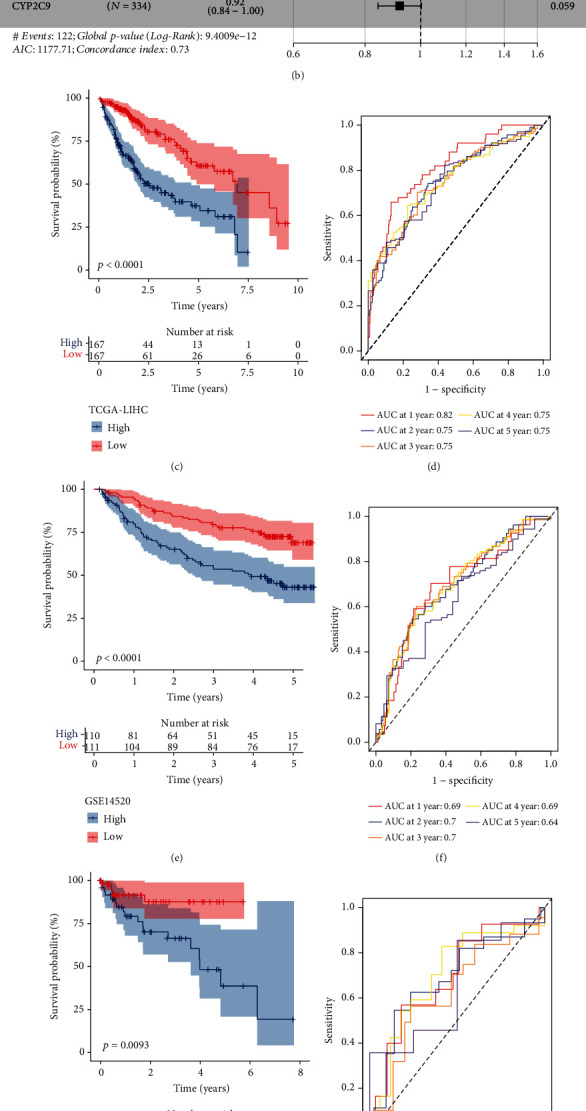
Figure 5.

Construction and verification of TET1 and demethylation-related risk model. (a) Venn plot of TET1-related DEGs and demethylation-related DEGs. (b) Hazard ratio of the 7 prognostic genes determined by stepAIC. Kaplan-Meier survival curves of high-risk and low-risk groups in TCGA (c), GSE14520 (e), GSE76427 (g), and ICGC (i) datasets. ROC curves of the risk model in predicting 1- to 5-year survival in TCGA (d), GSE14520 (f), GSE76427 (h), and ICGC (j) datasets.
