
FIGURE 3.
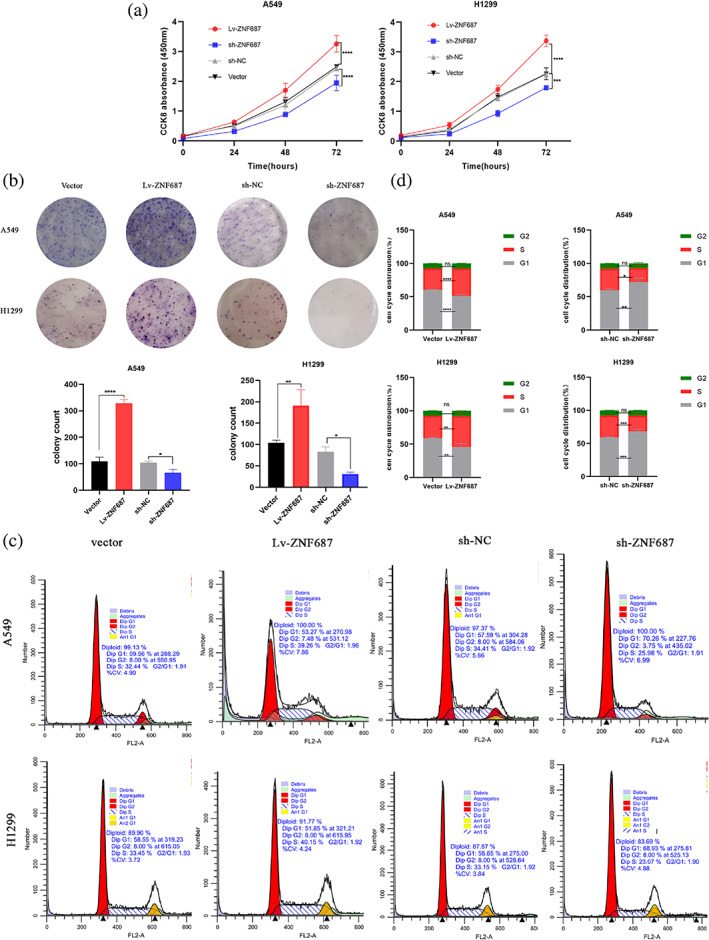
(a) Effect of ZNF687 overexpression and knockdown on cell growth via the cell counting kit‐8 (CCK‐8) assay. (b) A colony formation assay was utilized to assess ZNF687 cell growth. (c, d) Flow cytometry was utilized to identify the distribution of cell cycle phases. *p < 0.05; **p < 0.01; ***p < 0.001; and **** p < 0.0001. ns, nonsignificant.