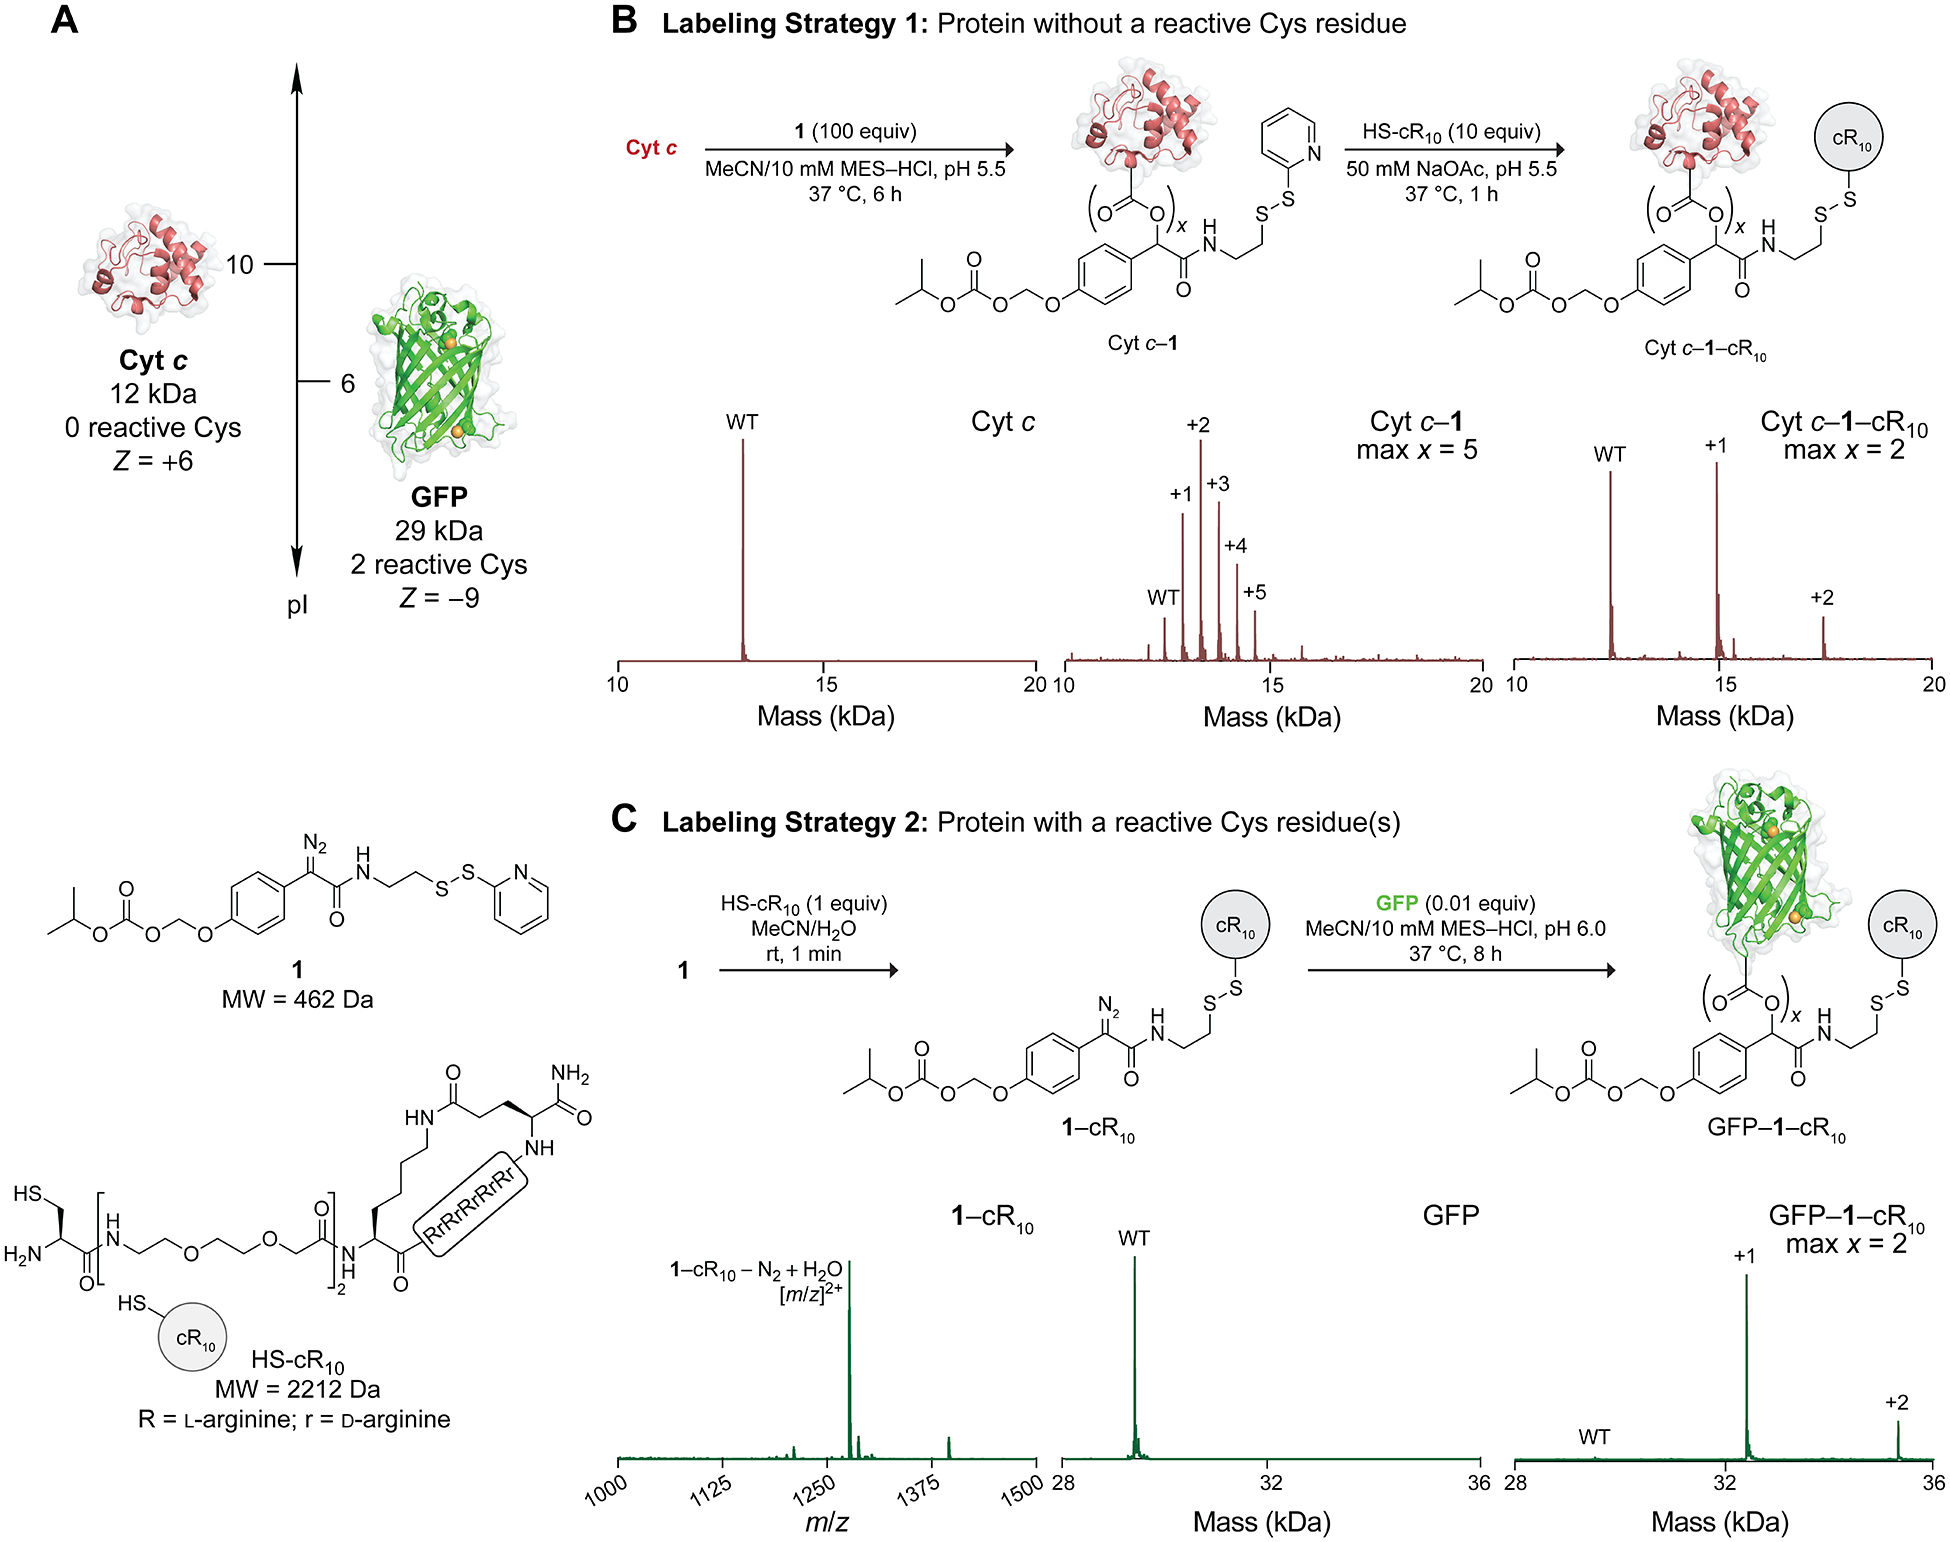
Figure 2.

(A) Model proteins and structures of 1 and HS-cR10. (B, C) Labeling strategies for proteins without and with reactive Cys residues. Corresponding Q-TOF MS data are shown under the labeling scheme. The numbers +1, etc. refer to the number of labels; “max x” refers to the maximum number of labels; “WT” refers to the native protein. Expected and observed masses are listed in the Supporting Information (Figures S7, S8, S16, and S17)
