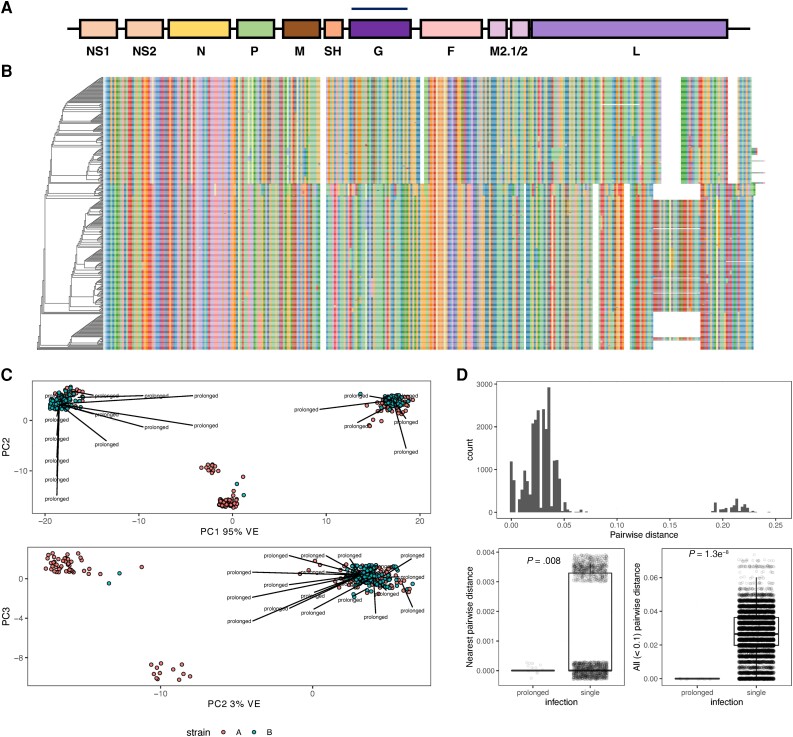
Figure 2.
Viral population structure. A, Linear map of the RSV genome. B, Phylogenetic tree based on multiple sequence alignment of G protein amino acid sequences. Color indicates amino acids. C, Principal component analysis. PCs 1–3 with labels indicating prolonged infections from different phylogenetic clades. D, A summary of every pairwise genetic distance between every viral sequence is shown (above). Genetic invariance in prolonged infections separated by at least 15 days was compared to other genetic variation within the most closely related sequences (below left) and within all possible closely related pairs (below right). Jitter applied for visualization. Abbreviations: G, glycoprotein; M, matrix protein; PC, principal component; RSV, respiratory syncytial virus; SH, small hydrophobic protein; VE, variance explained.

