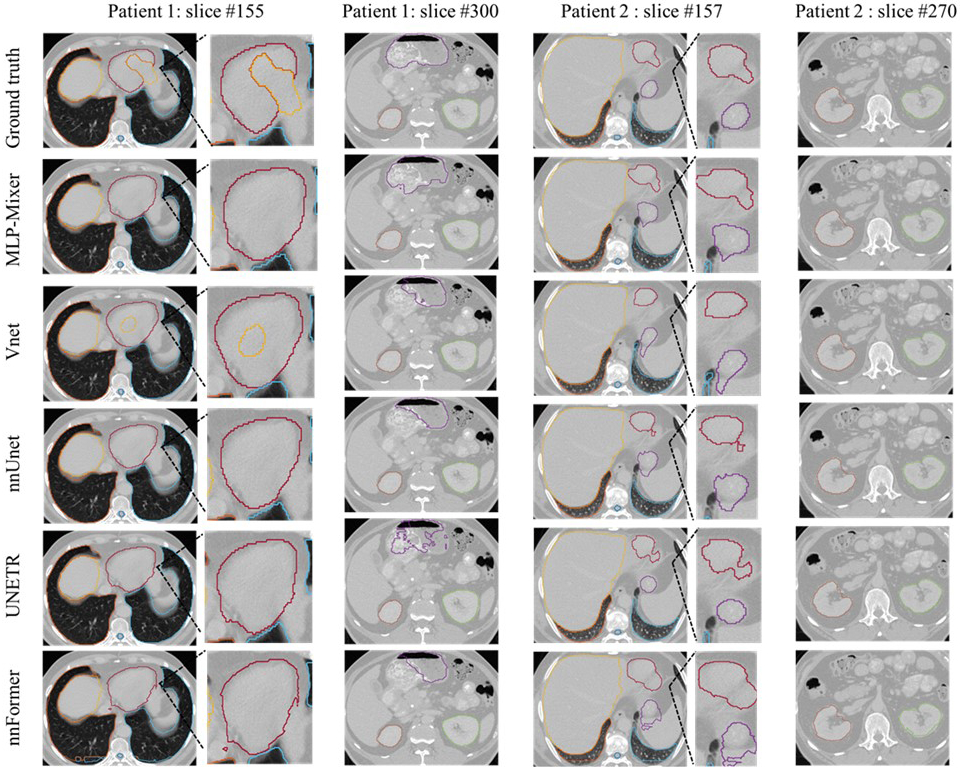
Figure 2:

Segmentation result on the institutional dataset including three patients. The manual contours (row 1), MLP-Vnet (row 2) and competing networks (row 3–6) are presented column-wise. Three patients’ examples are presented in totally four columns in order: slices of one patient are presented in every two columns. Each patient contains slices, including the heart (red), lung (light blue and deep orange), spinal cord (blue), kidneys (green and orange), liver (yellow), and stomach (purple). For patient #1, a zoom-in region containing the heart is displayed. For patient # 2, a zoom-in region shows differences in heart and stomach contours among the competing networks.
