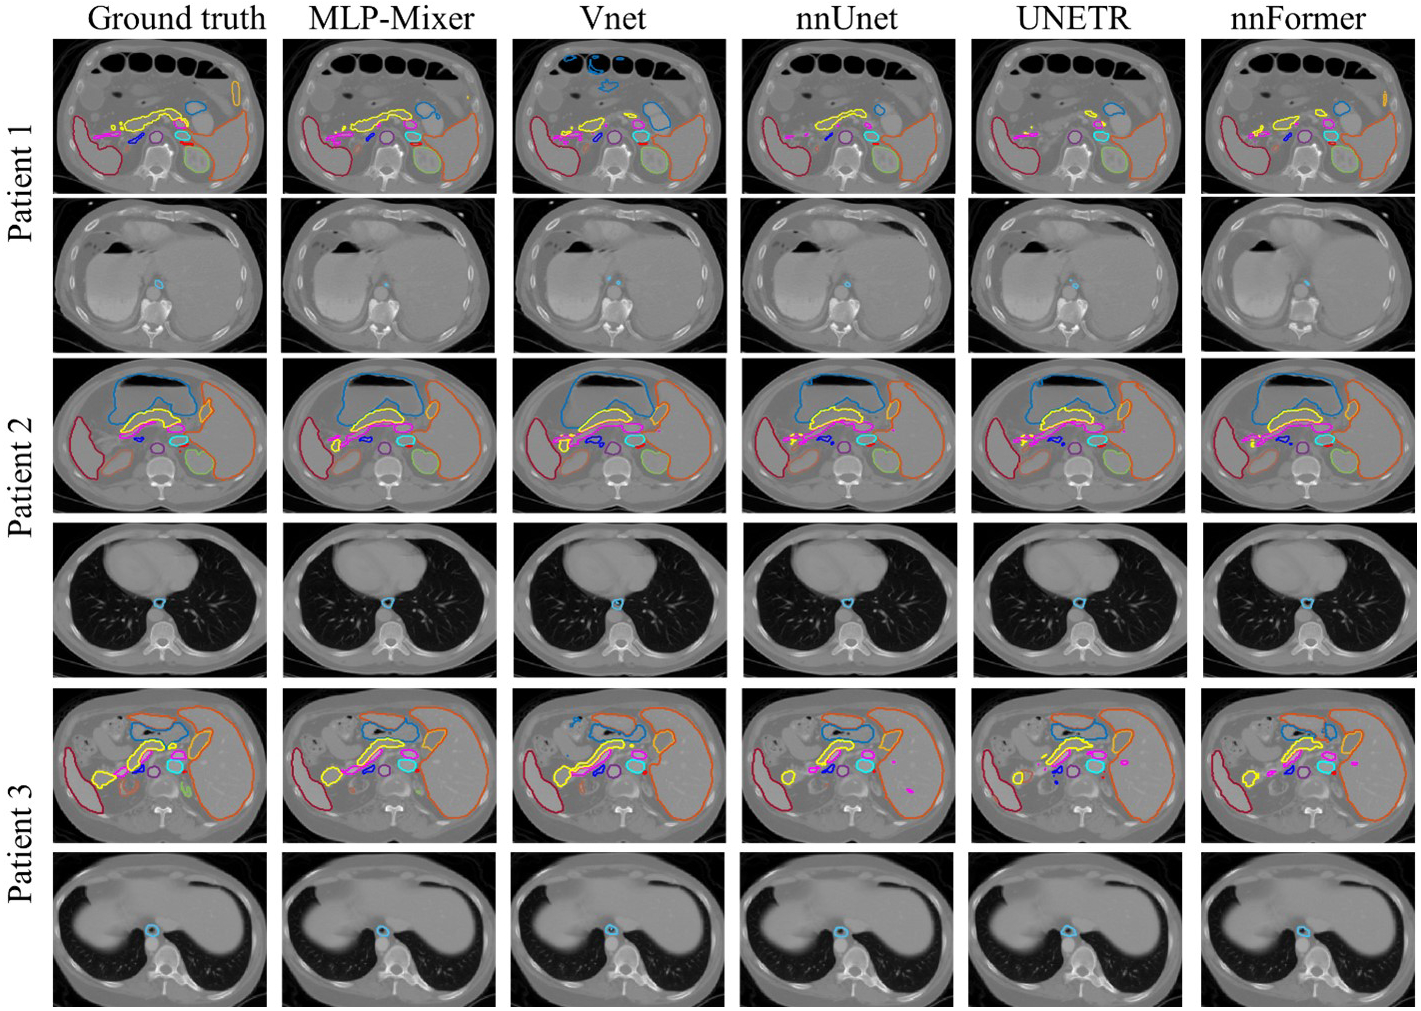
Figure 3:

Segmentation result on BCTV dataset including three patients. Manual contours (column 1) as well as results from MLP-Vnet (column 2) and all competing networks (column 3–6) are presented column-wise. Each patient’s slices are presented in two rows. For each patient, in its first row, central slices containing the spleen (deep red), left kidney (orange), right kidney (green), liver (light blue), stomach (blue), aorta (purple), inferior vena cave (cyan), vein (magenta), pancreas (light yellow), RAG (red), LAG (deep blue), and gallbladder (yellow) are shown. It’s second row presents slices for the esophagus (blue).
