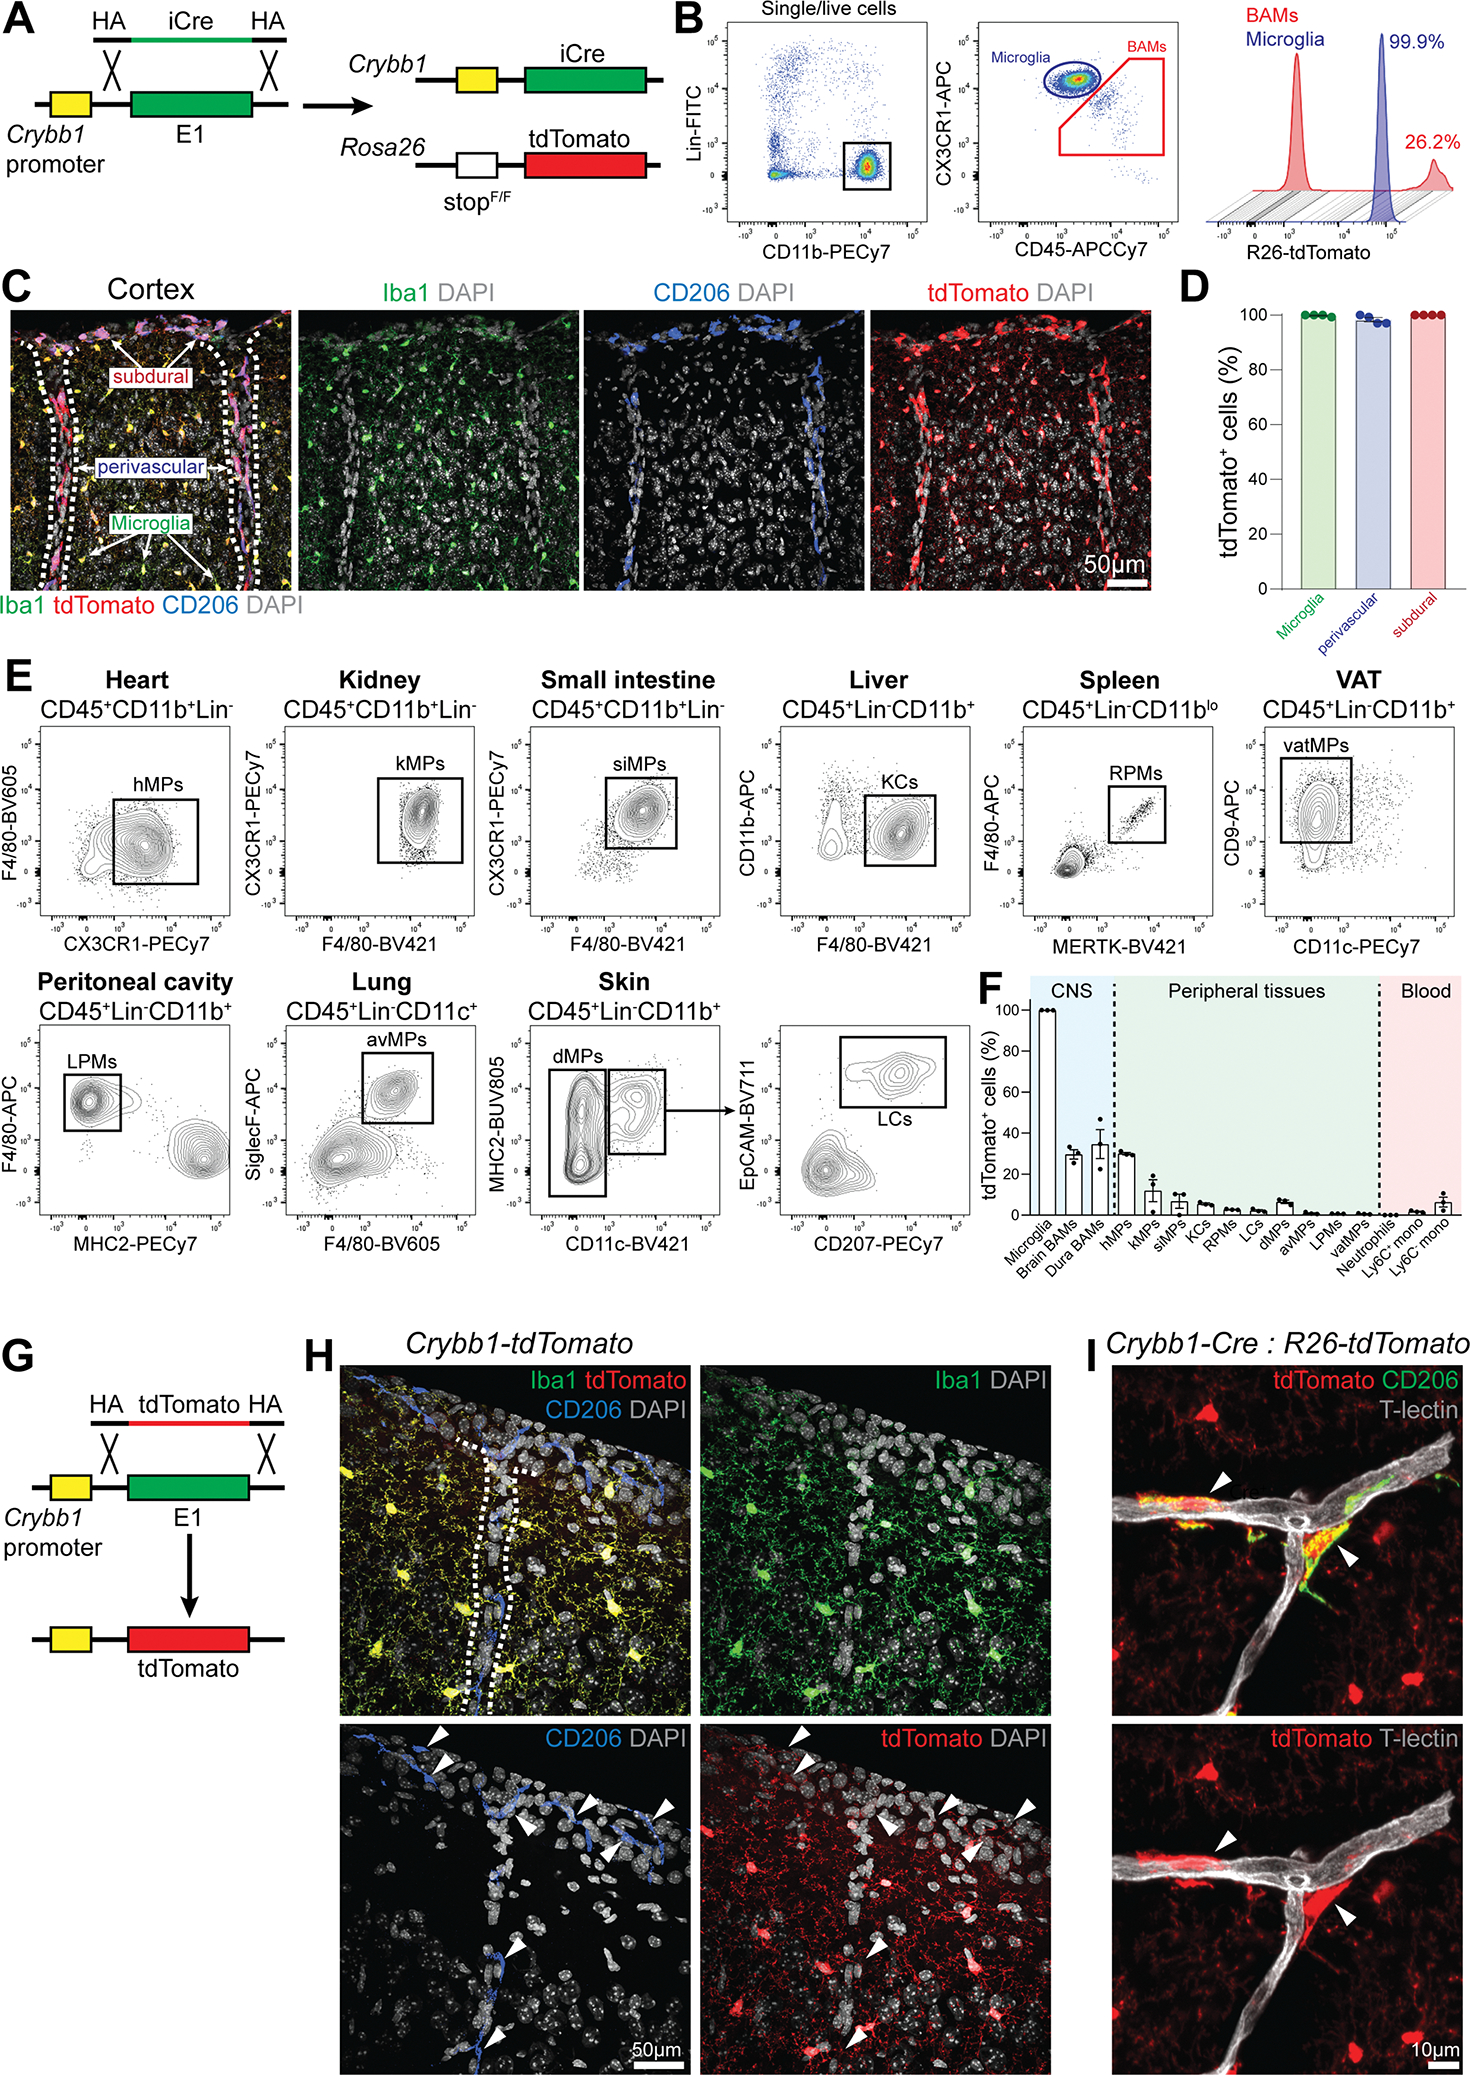
Figure 1. Crybb1-Cre efficiently recombines in microglia and subsets of BAMs.

(A) Strategy used to generate the Crybb1-Cre : R26-tdTomato reporter line.
(B) Representative gating strategy for microglia and BAMs in Crybb1-Cre : R26-tdTomato mice.
(C) Representative confocal images of microglia, subdural, and perivascular BAMs expressing tdTomato in Crybb1-Cre : R26-tdTomato mice (n=4 mice, 2 months old, single experiment, dashed lines = blood vessels).
(D) Percentage of microglia (Iba1+CD206−), subdural, and perivascular BAMs (CD206bright) expressing tdTomato (n=4 mice, 2 months old, single experiment).
(E) Representative gating for all myeloid cell populations analyzed in Crybb1-Cre : R26-tdTomato mice (hMPs = heart MPs; kMPs = kidney MPs; siMPs = small intestine MPs; KCs = Kupffer cells; RPMs = red pulp MPs; vatMPs = visceral adipose tissue MPs; LPMs = large peritoneal MPs; avMPs = alveolar MPs; dMPs = dermal MPs; LCs = Langerhans cells).
(F) Percentage of tdTomato+ cells in analyzed populations (n=3 mice, 6–8 weeks old, single experiment).
(G) Strategy used to generate the Crybb1-tdTomato reporter line.
(H) Representative confocal images of microglia and BAMs in Crybb1-tdTomato mice (n=3 mice, 2 months old, single experiment, dashed lines = blood vessel).
(I) Representative confocal image of CD206+ perivascular BAMs in Crybb1-Cre : R26-tdTomato mice (white arrowheads) (n=3 mice, single experiment).
See also Figure S1
