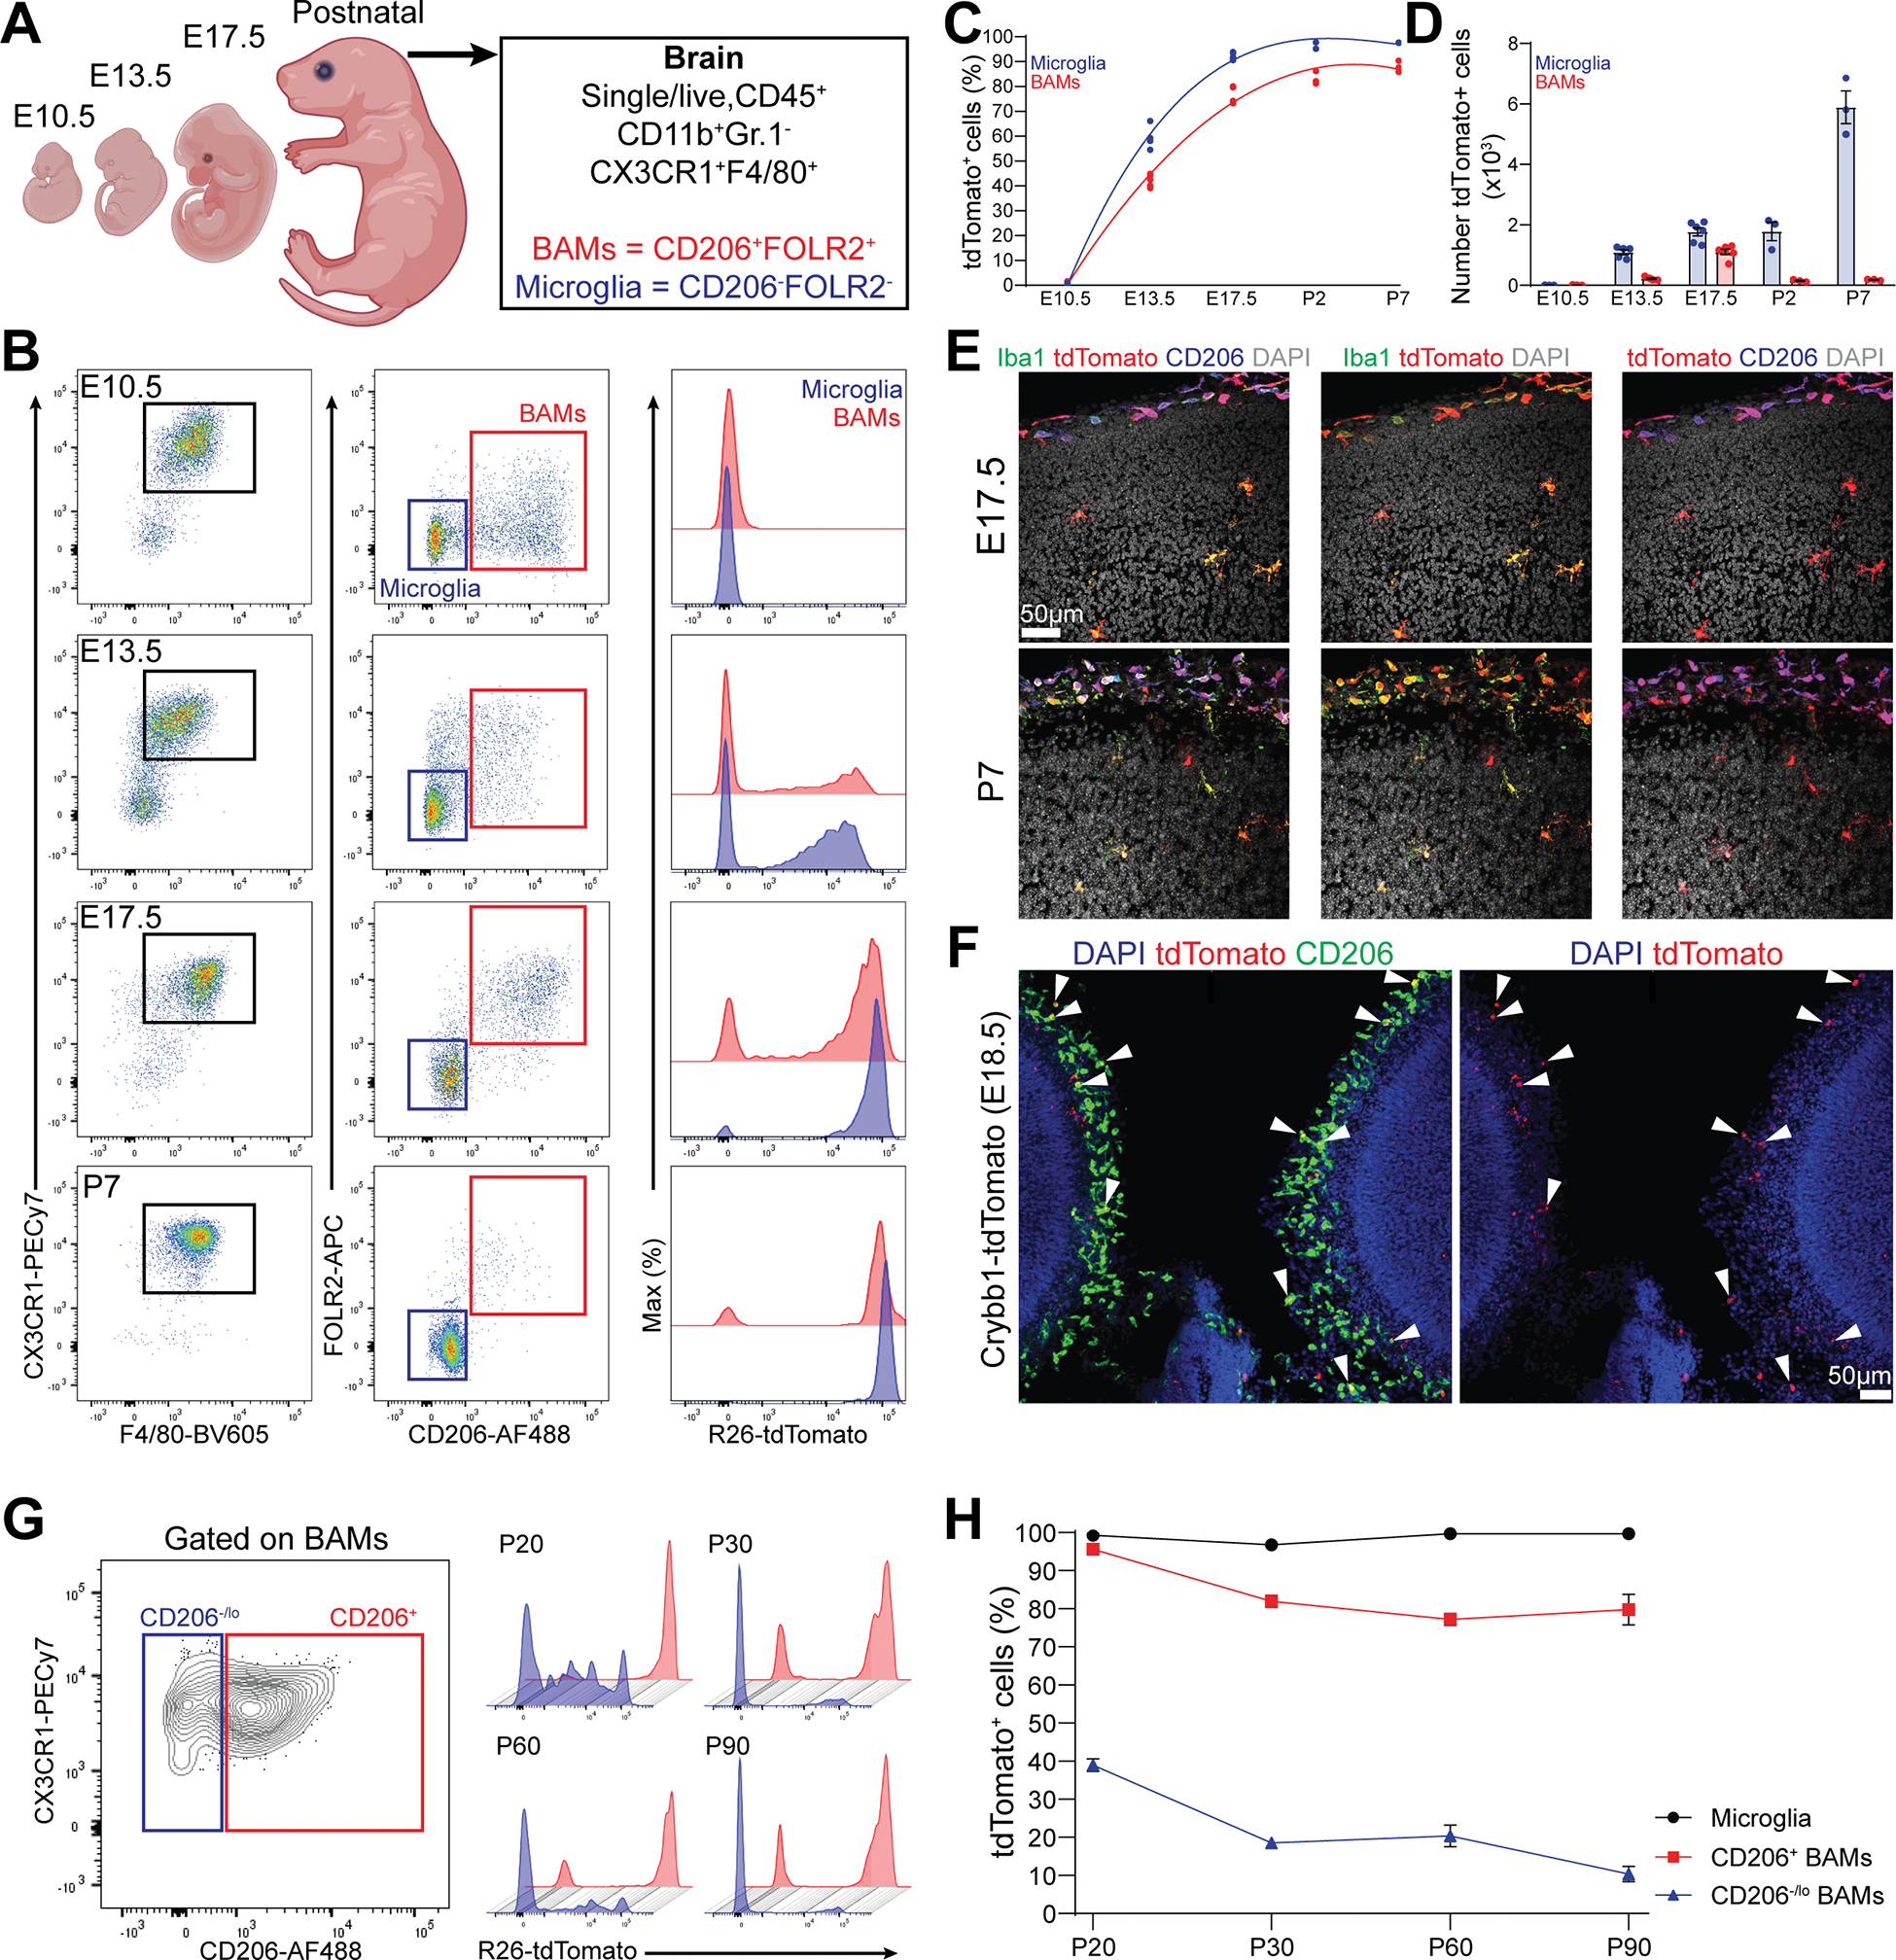
Figure 2. Crybb1-Cre recombination activity peaks during the embryonic brain development.

(A) Cartoon describing the experimental design and gating strategy.
(B) Representative gating strategy for microglia and BAMs in Crybb1-Cre : R26-tdTomato mice at different timepoints.
(C) Percentage of tdTomato+ microglia and BAMs from E10.5 to P7 (n=3–6 mice/timepoint, single experiment).
(D) Absolute numbers of microglia and BAMs from E10.5 to P7 (n=3–6 mice/timepoint, single experiment).
(E) Representative confocal images of microglia and BAMs expressing tdTomato in the forebrain cortex of E17.5 embryos and P7 Crybb1-Cre : R26-tdTomato mice (n=3 embryos and n=2 pups, single experiment).
(F) Representative confocal images of microglia and BAMs expressing tdTomato in the forebrain cortex of E18.5 Crybb1-tdTomato embryos (white arrowheads) (n=5 embryos, single experiment).
(G) Representative gating strategy for CD206+ and CD206− BAMs in Crybb1-Cre : R26-tdTomato mice at different timepoints.
(H) Percentage of tdTomato+ microglia, CD206+ and CD206− BAMs in Crybb1-Cre : R26-tdTomato mice at different timepoints (n=3 mice/timepoint, single experiment).
See also Figure S2
