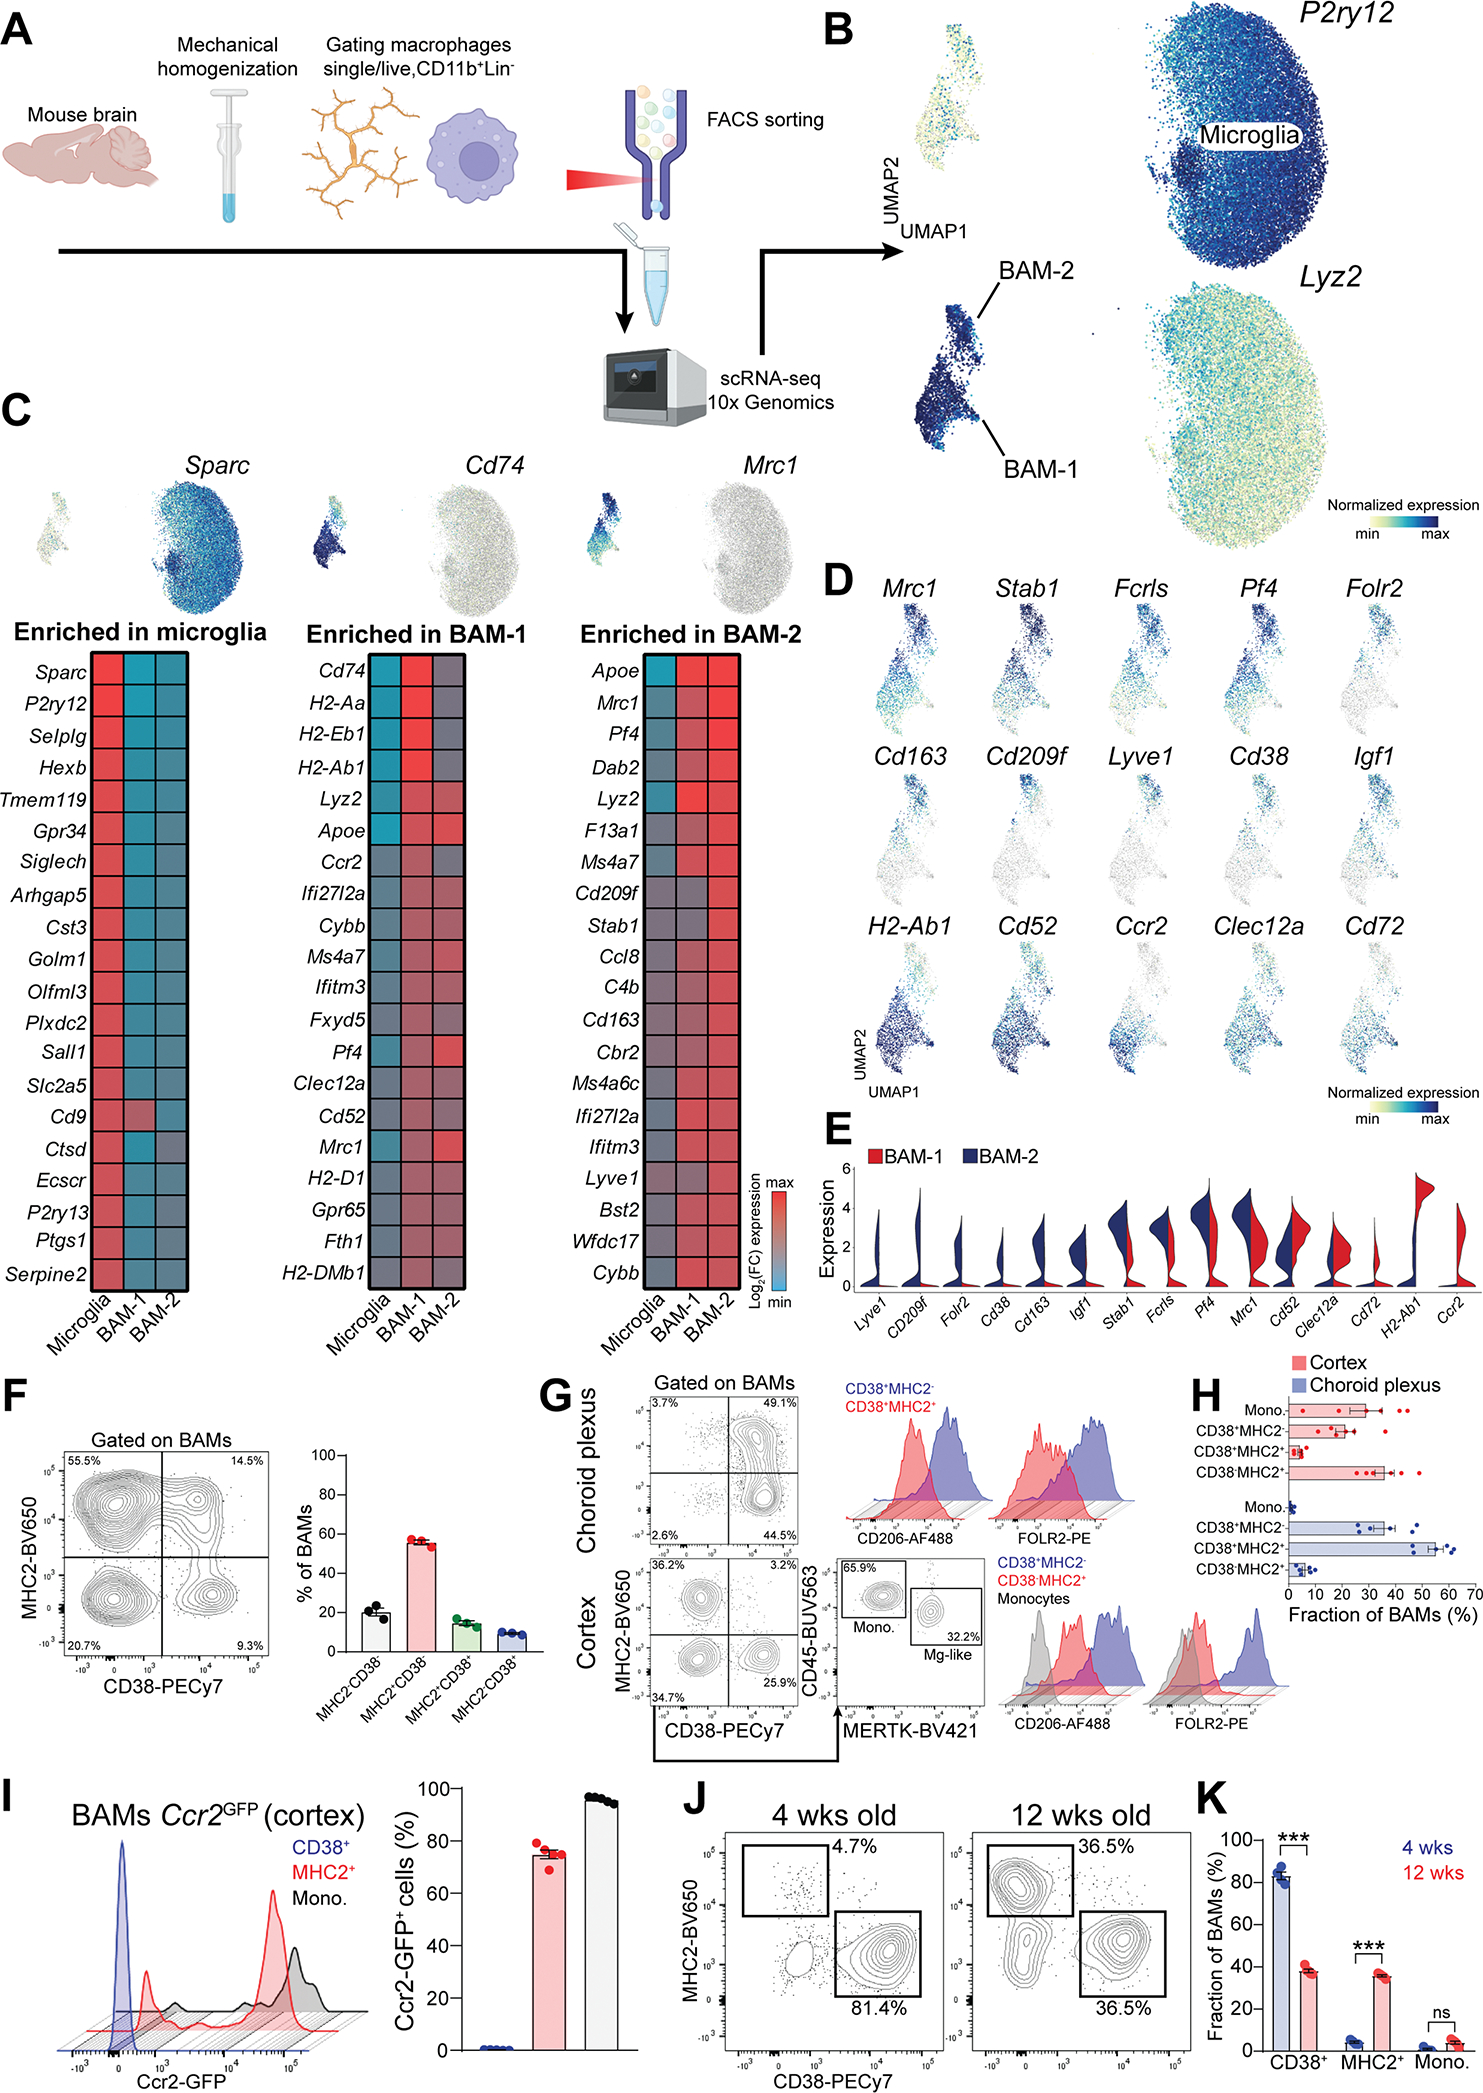
Figure 3. Two major BAM subsets populate the homeostatic brain.

(A) Cartoon describing the experimental design.
(B) UMAP plot of microglia and BAMs (n=5 wild-type and n=4 5xFAD littermate mice, 8month-old).
(C) Heatmap of the top 20 signature genes for microglia, BAM-1 and BAM-2 populations (n=5 wild-type mice, 8-month-old).
(D) Enrichment of selected signature genes for BAM-1 and BAM-2 populations.
(E) Expression of selected signature genes for BAM-1 and BAM-2 populations.
(F) Representative FACS plot and percentage of different BAM subsets defined based on MHC2 and CD38 surface expression (n=3 wild-type mice, 3-month-old, single experiment).
(G) Representative gating for different BAM subsets in choroid plexus and cortex. Surface expression of CD206 and FOLR2 in each population is displayed.
(H) Frequency of different BAM subsets in choroid plexus and cortex, within the total BAM population (n=6 mice, 2-month-old, pool of two independent experiments).
(I) Percentage of GFP+ BAMs in the cortex of Ccr2GFP mice (n=5 mice, 3-month-old, single experiment).
(J) Representative FACS plot of MHC2+ and CD38+ BAM subsets in the cortex of 4- and 12-week-old mice.
(K) Frequency of different BAM subset within the total BAM population in the cortex of 4-and 12-week-old mice (n=4–5 mice/group, two-way ANOVA with Bonferroni post-hoc test, ***P<0.001, single experiment).
See also Figure S3
