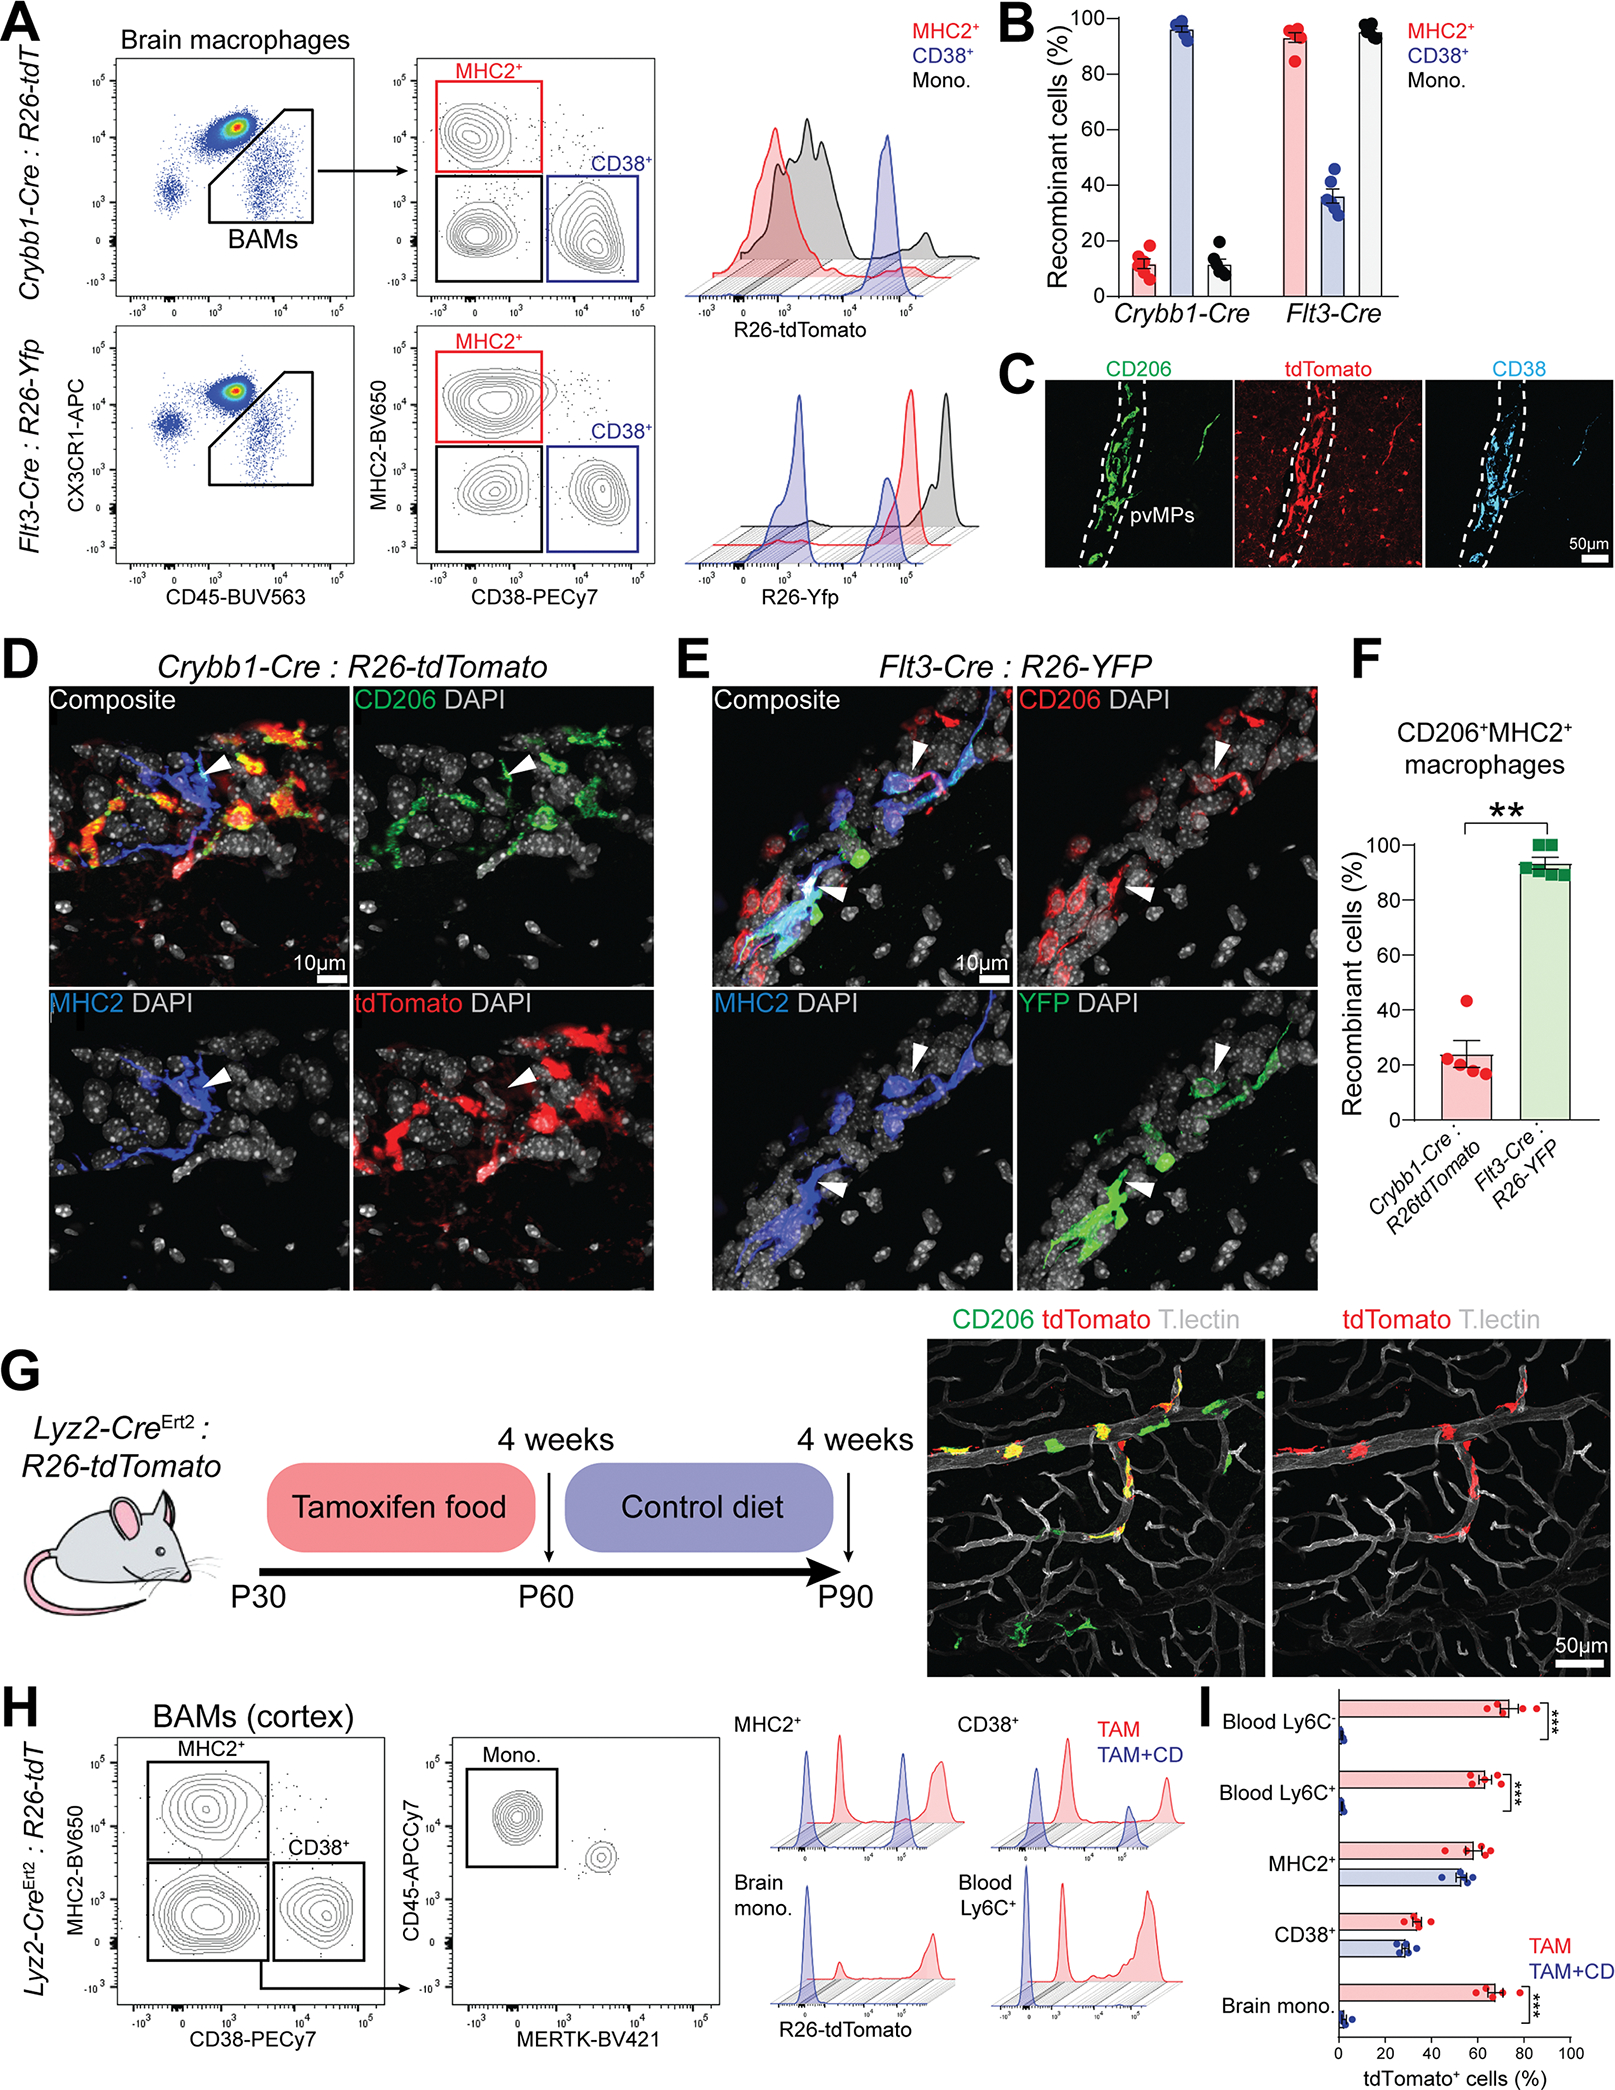
Figure 4. CD38+ and MHC2+ BAM subsets have different origins.

(A) Representative FACS plot of different BAM subsets defined based on MHC2 and CD38 surface expression from Crybb1-Cre : R26-tdTomato and Flt3-Cre : R26-Yfp mice.
(B) Percentage of recombination in all BAM subsets from either Crybb1-Cre : R26-tdTomato or Flt3-Cre : R26-Yfp mice (n=6 mice/group, 2–3 months old, pool of two independent experiments).
(C) Representative confocal images of CD206 and CD38 staining on perivascular BAMs in Crybb1-Cre : R26-tdTomato mice (n=3 mice, 2–3 months old, single experiment).
(D) Representative confocal images of CD206+MHC2+ BAMs in Crybb1-Cre : R26-tdTomato mice (white arrowheads, n=5 mice/group, 2–3 months old, two independent experiments).
(E) Representative confocal images of CD206+MHC2+ BAMs in Flt3-Cre : R26-Yfp mice (white arrowheads, n=6 mice/group, 2–3 months old, two independent experiments).
(F) Percentage of recombination in CD206+MHC2+ cortical BAMs from either Crybb1-Cre : R26-tdTomato and Flt3-Cre : R26-Yfp mice (n=5–6 mice/group, 2–3 months old, pool of two independent experiments).
(G) Cartoon describing the experimental design. A representative confocal image of recombinant CD206+ perivascular BAMs from Lyz2CreErt2 : R26-tdTomato after four weeks of TAM treatment is displayed.
(H) Representative FACS plot of different BAM subsets defined based on MHC2 and CD38 surface expression from Lyz2CreErt2 : R26-tdTomato mice that underwent TAM treatment regimen.
(I) Percentage of recombination in all BAM subsets and blood Ly6C+ and Ly6C− monocytes from Lyz2CreErt2 : R26-tdTomato mice upon four weeks of TAM treatment and after additional four weeks of control diet (n=5 mice/group, 2–3 months old, two-way ANOVA with Bonferroni post-hoc test, ***P<0.001, single experiment).
See also Figure S4
