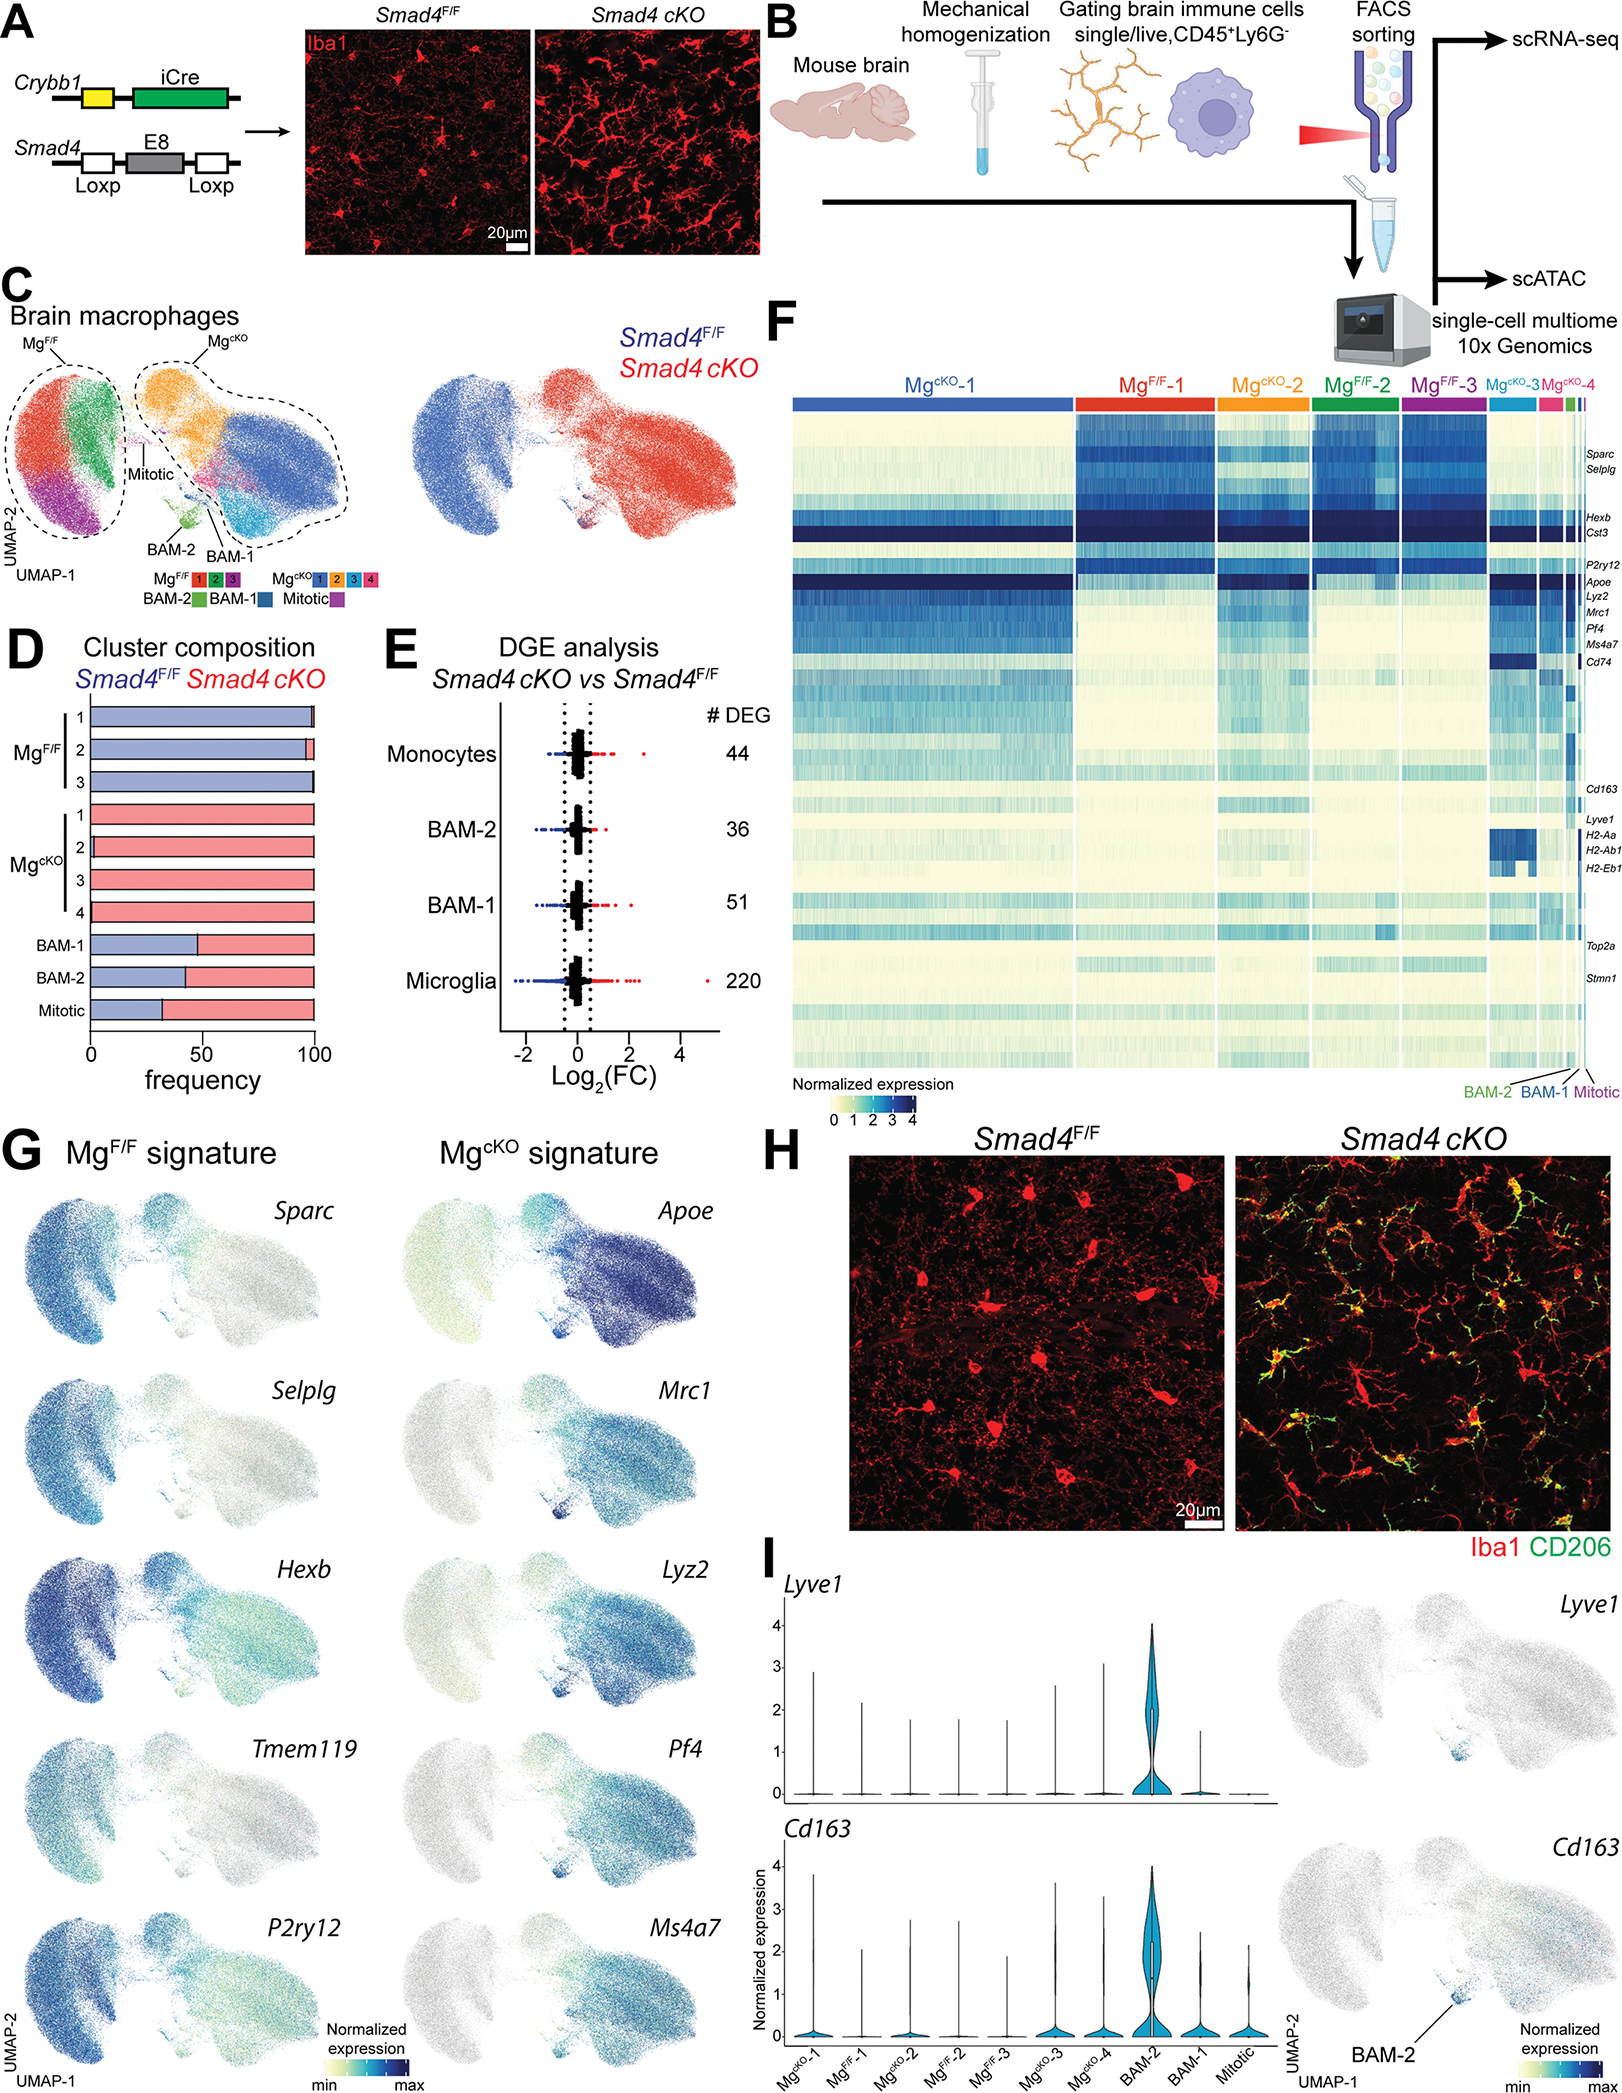
Figure 5. Maturation failure of SMAD4-deficient microglia.

(A) Strategy used to generate the Smad4 cKO line. Representative confocal image of microglia from either Smad4F/F and Smad4 cKO (n=5 mice/genotype, 4-week-old, two independent experiments).
(B) Cartoon describing the experimental design.
(C) UMAP plot of microglia and BAMs from Smad4F/F and Smad4 cKO littermate mice, split either by cluster or genotype (n=4 mice/genotype, 6–8 weeks old).
(D) Percentage of genotypes in each cluster.
(E) Number and fold-change of differentially expressed genes in brain myeloid populations from Smad4F/F and Smad4 cKO mice.
(F) Heatmap of the top 10 signature genes per cluster.
(G) UMAP plot showing the differential expression of signature genes in Smad4F/F and Smad4 cKO mice.
(H) Representative confocal images of CD206 staining on microglia from Smad4F/F and Smad4 cKO mice (n=5 mice/genotype, 4-week-old, two independent experiments).
(I) UMAP and violin plots showing the expression of Lyve1 and Cd163 in each cluster.
See also Figure S5
