
Figure 6. Broad epigenetic changes in SMAD4-deficient microglia.
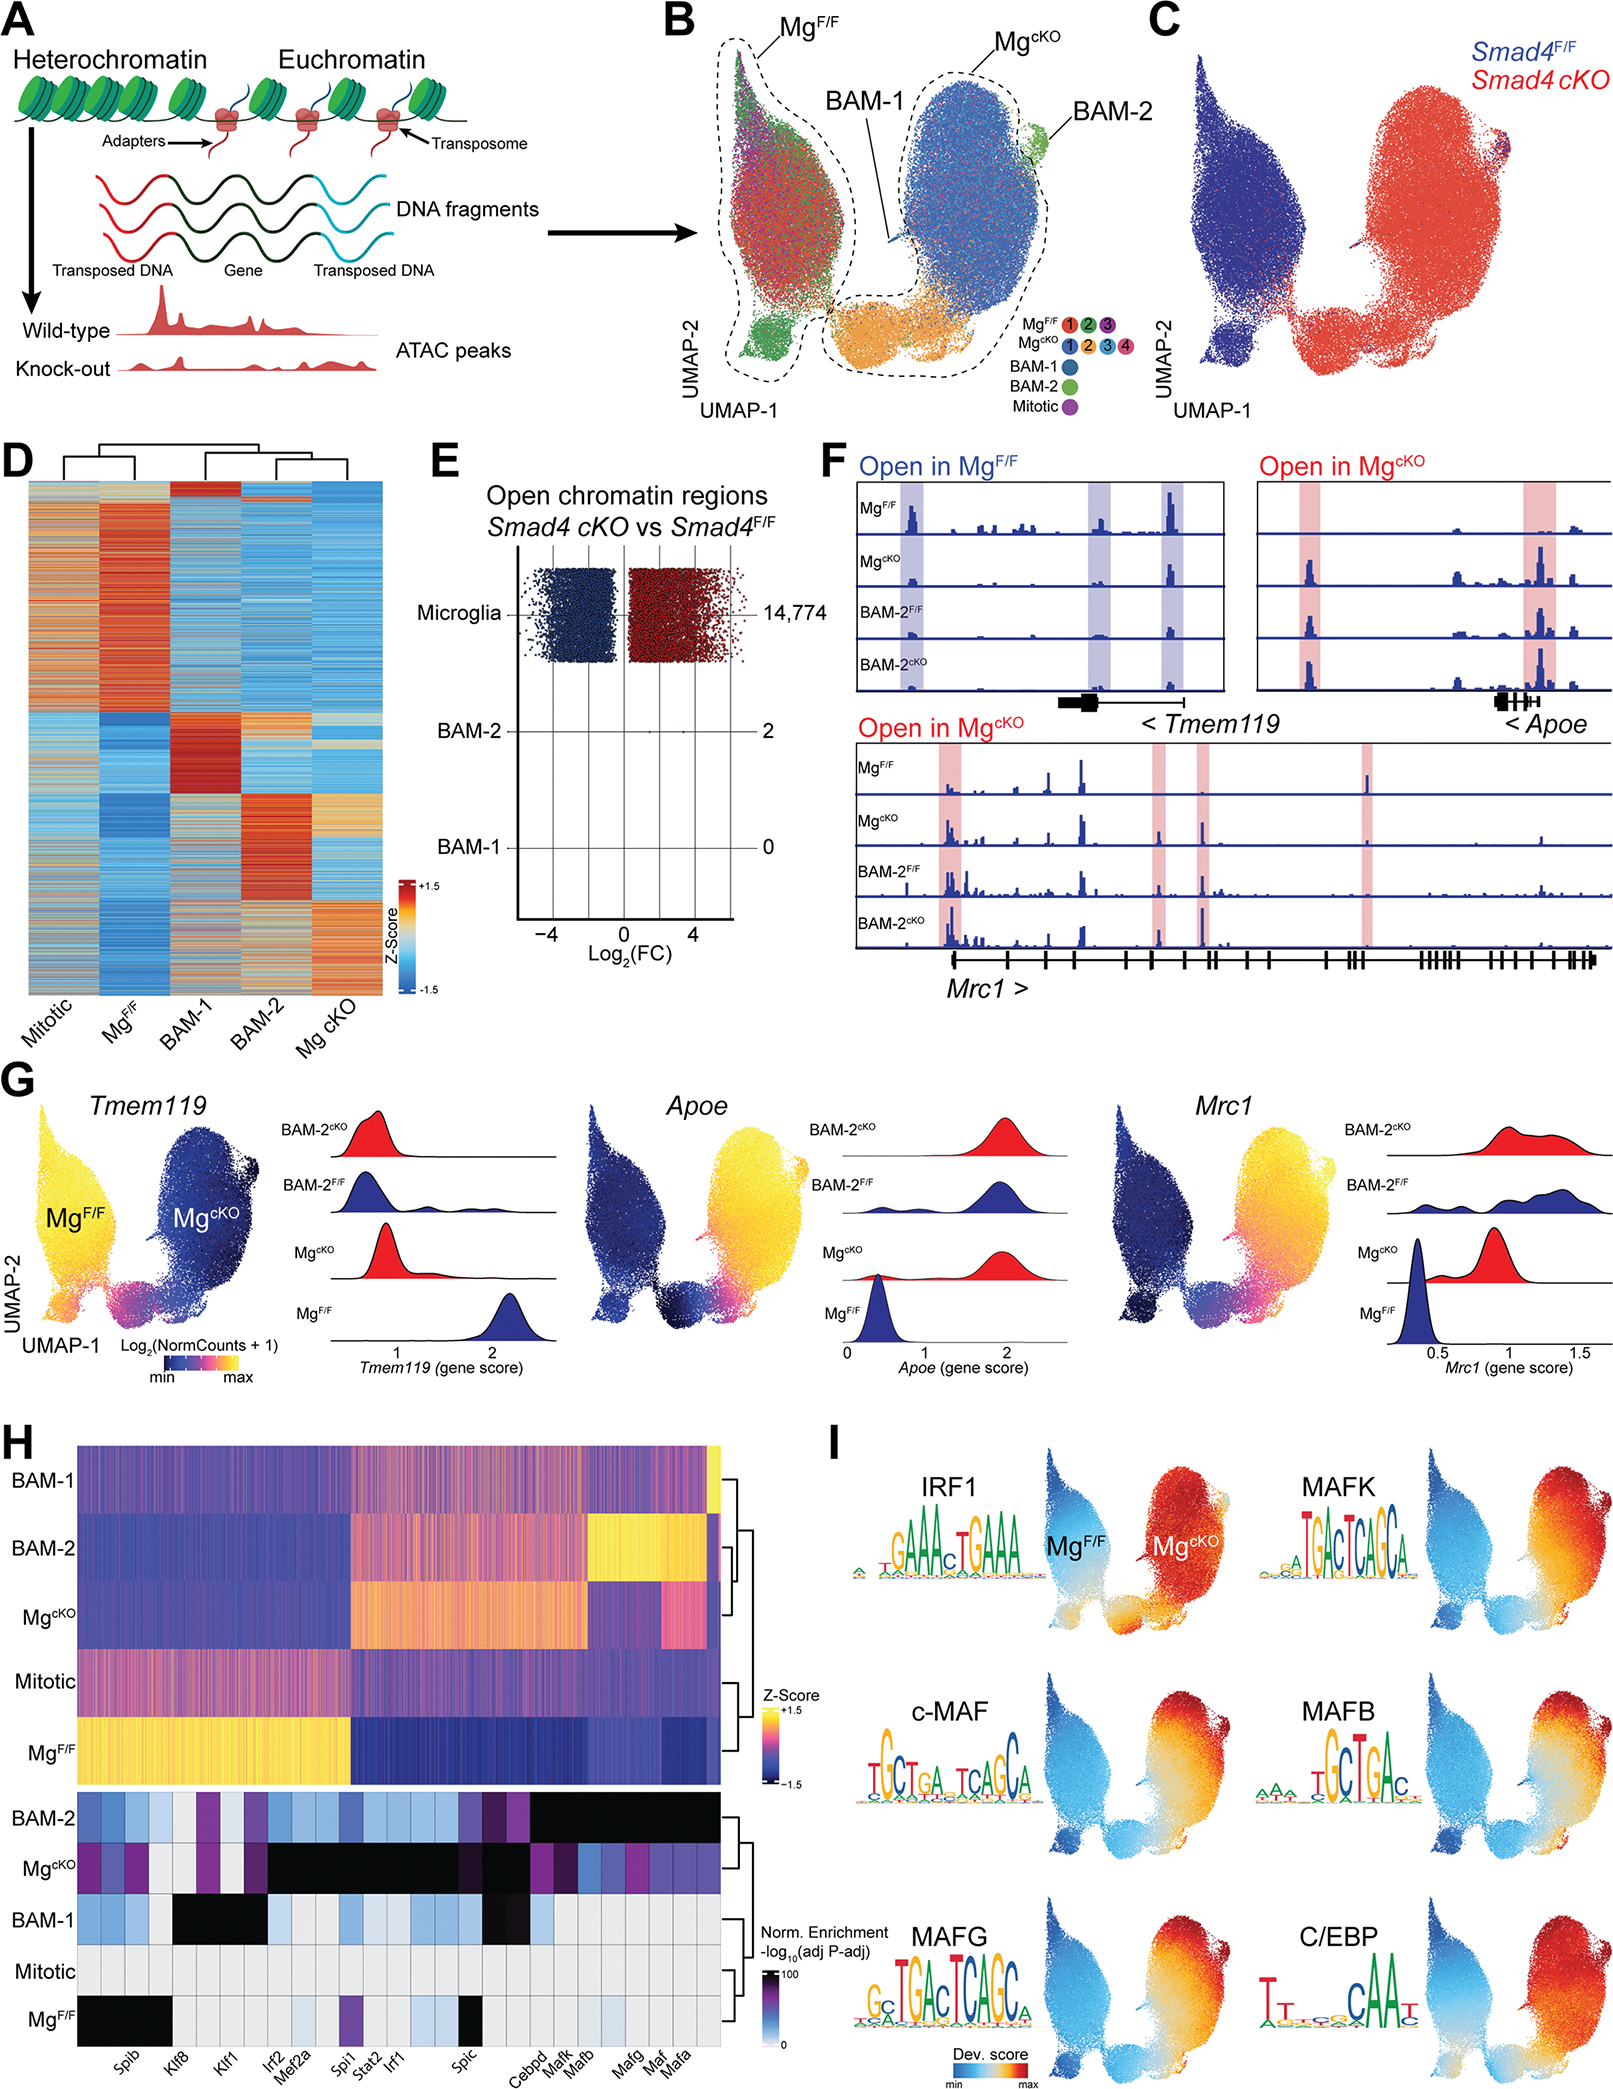
(A) Cartoon describing scATAC-seq protocol and analysis.
(B) UMAP of the scATAC-seq profiles of microglia and BAMs from Smad4F/F and Smad4 cKO littermate mice split by cluster (n=4 mice/genotype, 6–8 weeks old).
(C) UMAP of the scATAC-seq profiles of microglia and BAMs split by genotype.
(D) Heatmap displaying accessibility of 6,335 marker genes for the indicated cell populations.
(E) Number and fold-change of differential OCRs in Smad4 cKO vs Smad4F/F for the indicated cell types.
(F) Pseudo-bulk ATAC-seq coverage of selected gene loci.
(G) UMAP of the scATAC-seq profiles colored by accessibility of the indicated gene, and quantification of locus accessibility (gene score) by cell population and genotype.
(H) Heatmap of 16,270 OCRs in the indicated cell populations and top enriched motifs for each population. Up to 8 motifs are shown per population.
(I) UMAP of the scATAC-seq profiles colored by enrichment of the indicated TF motifs.
See also Figure S6