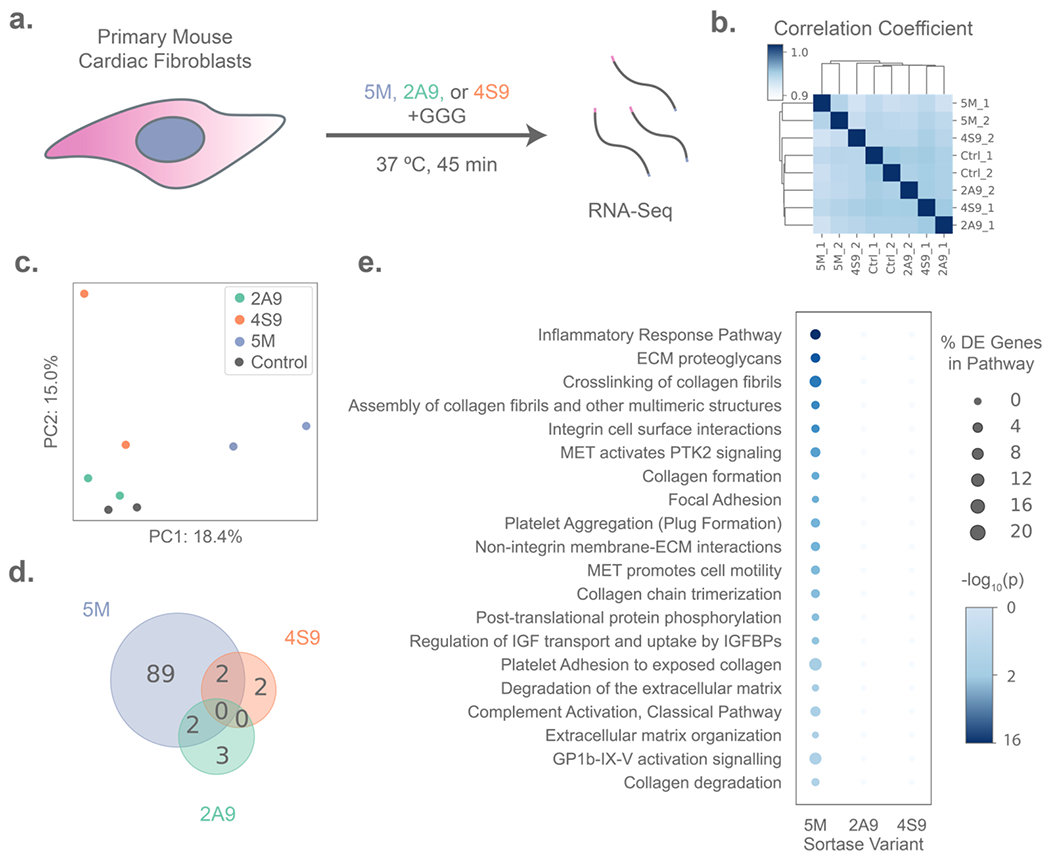
Figure 1 –

Transcriptomic analysis of primary cell responses to treatment with evolved sortase variants. (A) Experimental schematic in which primary mouse cardiac fibroblasts (n = 2 per condition) were treated with either 50 μM of a sortase variant (5M, 2A9, or 4S9) and 18 mM triglycine (GGG) peptide, or GGG-only control for 45 minutes before lysis for RNA isolation and sequencing. (B) Primary fibroblasts treated with 2A9 and 4S9 are more transcriptionally variable between technical replicates than controls, as illustrated by hierarchical clustering based on Euclidean distance of gene expression, whereas 5M-treated samples form a distinct cluster. (C) Principal Component Analysis (PCA) plot showing separation of sortase-treated samples on the first two principal components (PCs), with PC1 separating 5M-treated samples from all other groups and PC2 distinguishing 2A9 and 4S9 from controls. (D) Treatment with 2A9 and 4S9 results in lower numbers of differentially expressed genes than 5M versus the controls, as depicted by Venn diagram. (E) 5M (but not 2A9 or 4S9) treatment results in the differential regulation of genes significantly enriched in several biological pathways identified by G:Profiler analysis, with bubbles sized by the percentage of genes in a pathway that are differentially expressed in each sortase treatment, and shaded by p-value for enrichment (Fisher’s Exact Test).
