
Fig 2. Identification of the Ifng silencer CNS–28.
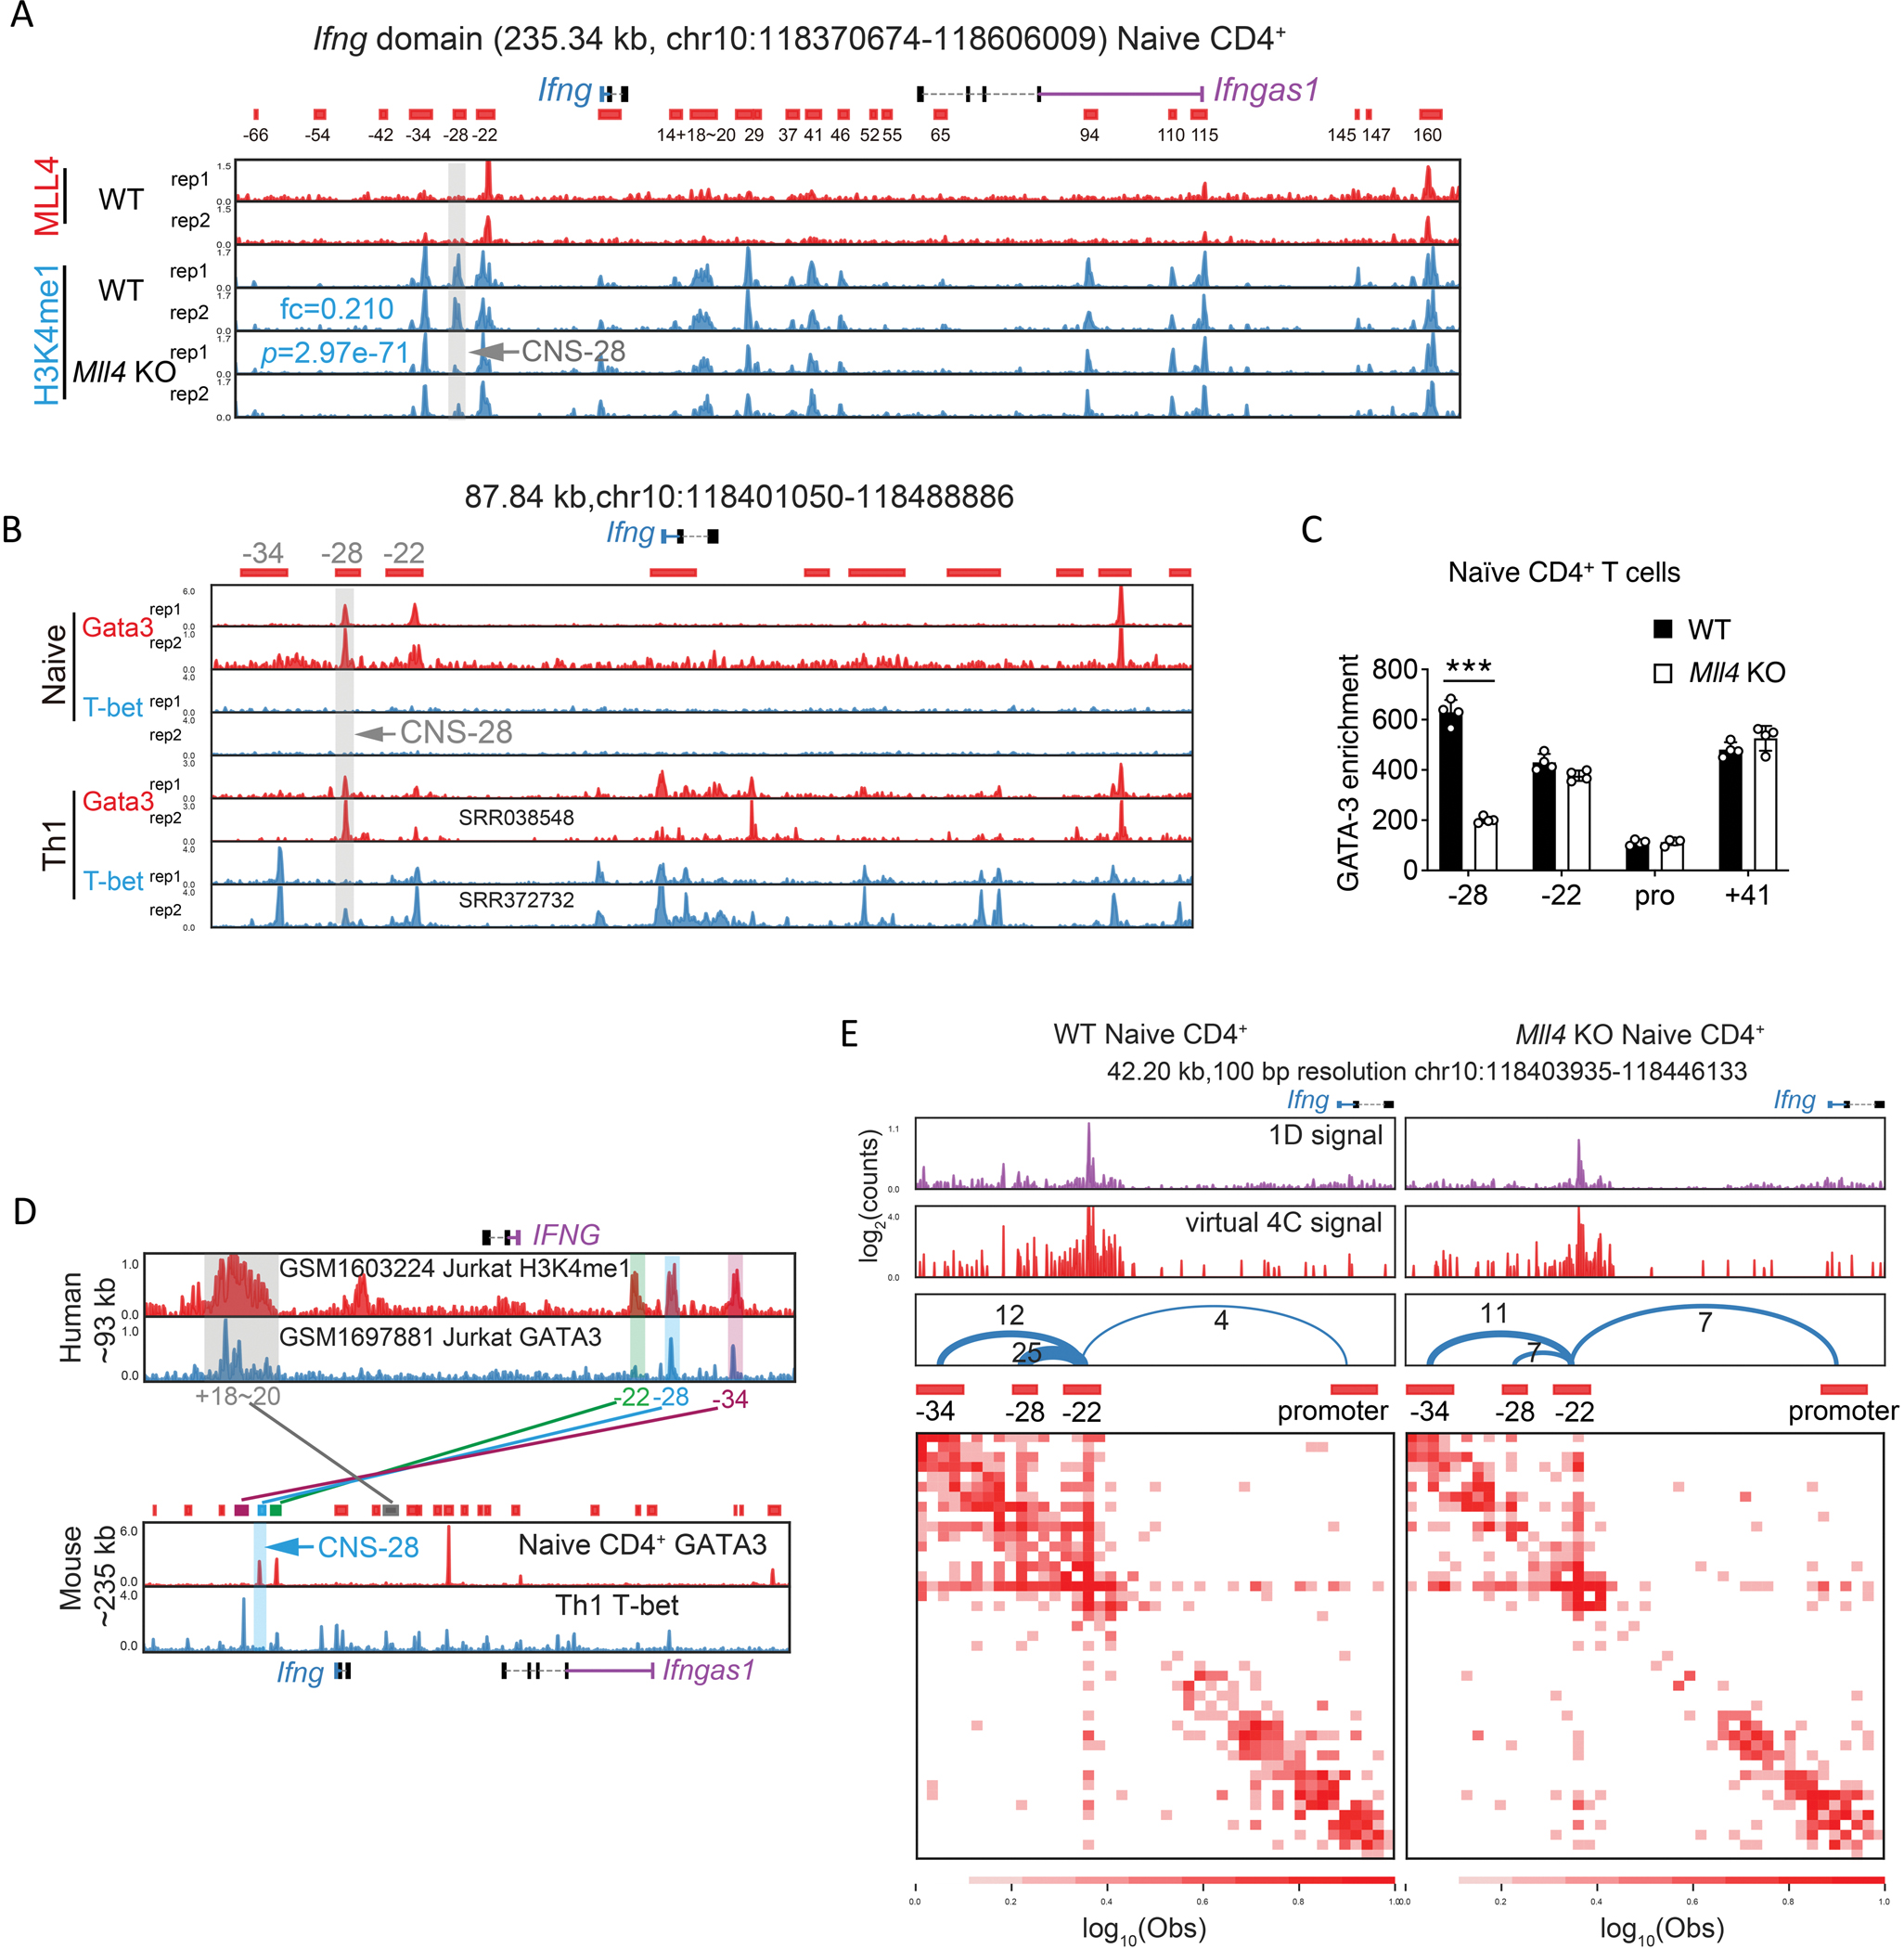
(A) Genome browser images of MLL4 and H3K4me1 ChIP-seq profiles in the Ifng domain. The ChIP-seq data were obtained from 32. Peaks were called and combined from H3K4me1 ChIP-seq data in WT naïve CD4+ and Th1 cells by cLoops2 and shown as the red blocks below the genes as putative cis-regulatory elements, annotated according to the relative distance to Ifng promoter, with – standing for upstream and + indicating downstream of Ifng TSS. The gray bar and arrow highlighted the absence of an H3K4me1 peak located at CNS-28 after the deletion of MLL4. The mean of normalized reads counts (to a total of 10 million reads) from two replicates of H3K4me1 ChIP-seq in the CNS-28 locus were used to calculate fold change (KO/WT) and Poisson P-value.
(B) Genome browser images of GATA-3 and T-bet ChIP-seq binding profiles around Ifng in naïve CD4+ T cells and Th1 differentiated cells. Th1 GATA-3 ChIP-seq data annotated with SRR038548 was obtained from 26, Th1 T-bet ChIP-seq data annotated with SRR372732 was obtained from 59, and the other ChIP-seq data shown in this panel were generated in this study.
(C) ChIP-qPCR analysis of GATA-3 binding to CNS–28, CNS–22, Ifng promoter and CNS+41 at the Ifng locus in WT and Mll4 KO naïve CD4+ T cells.
(D) Histone modification mark H3K4me1 at CNS–34, CNS–28, CNS–22 and CNS+18–20 is conserved between human T lymphocyte cell line Jurkat and mouse CD4+ T cells, while binding of GATA-3 is only conserved at CNS–28. CNS–28 is not bound by T-bet in mice Th1 cells. Human IFNG gene is located in negative strand and mouse Ifng gene is located in positive strand. GATA-3 ChIP-seq data in naïve CD4+ cells and T-bet ChIP-seq data in Th1 cells were generated in this study and were also shown in panel B. Human ChIP-seq data were obtained from 60 and 61 with the annotation of GSM number from GEO in the figure.
(E) The interaction matrix heatmaps from Hi-TrAC data around CNS–34, –28, –22, and Ifng promoter in WT and Mll4 KO naïve CD4+ T cells. CNS–22 was set as the viewpoint for the virtual 4C plots. The number of interacting reads for each chromatin loop is shown above the arches. The cLoops2 plot module generated the plots.
Data are representative of at least two independent experiments (A-E). ***p < 0.001. NS: not statistically significant. (Two-way ANOVA with Tukey’s multiple comparison test, error bars represent SD).