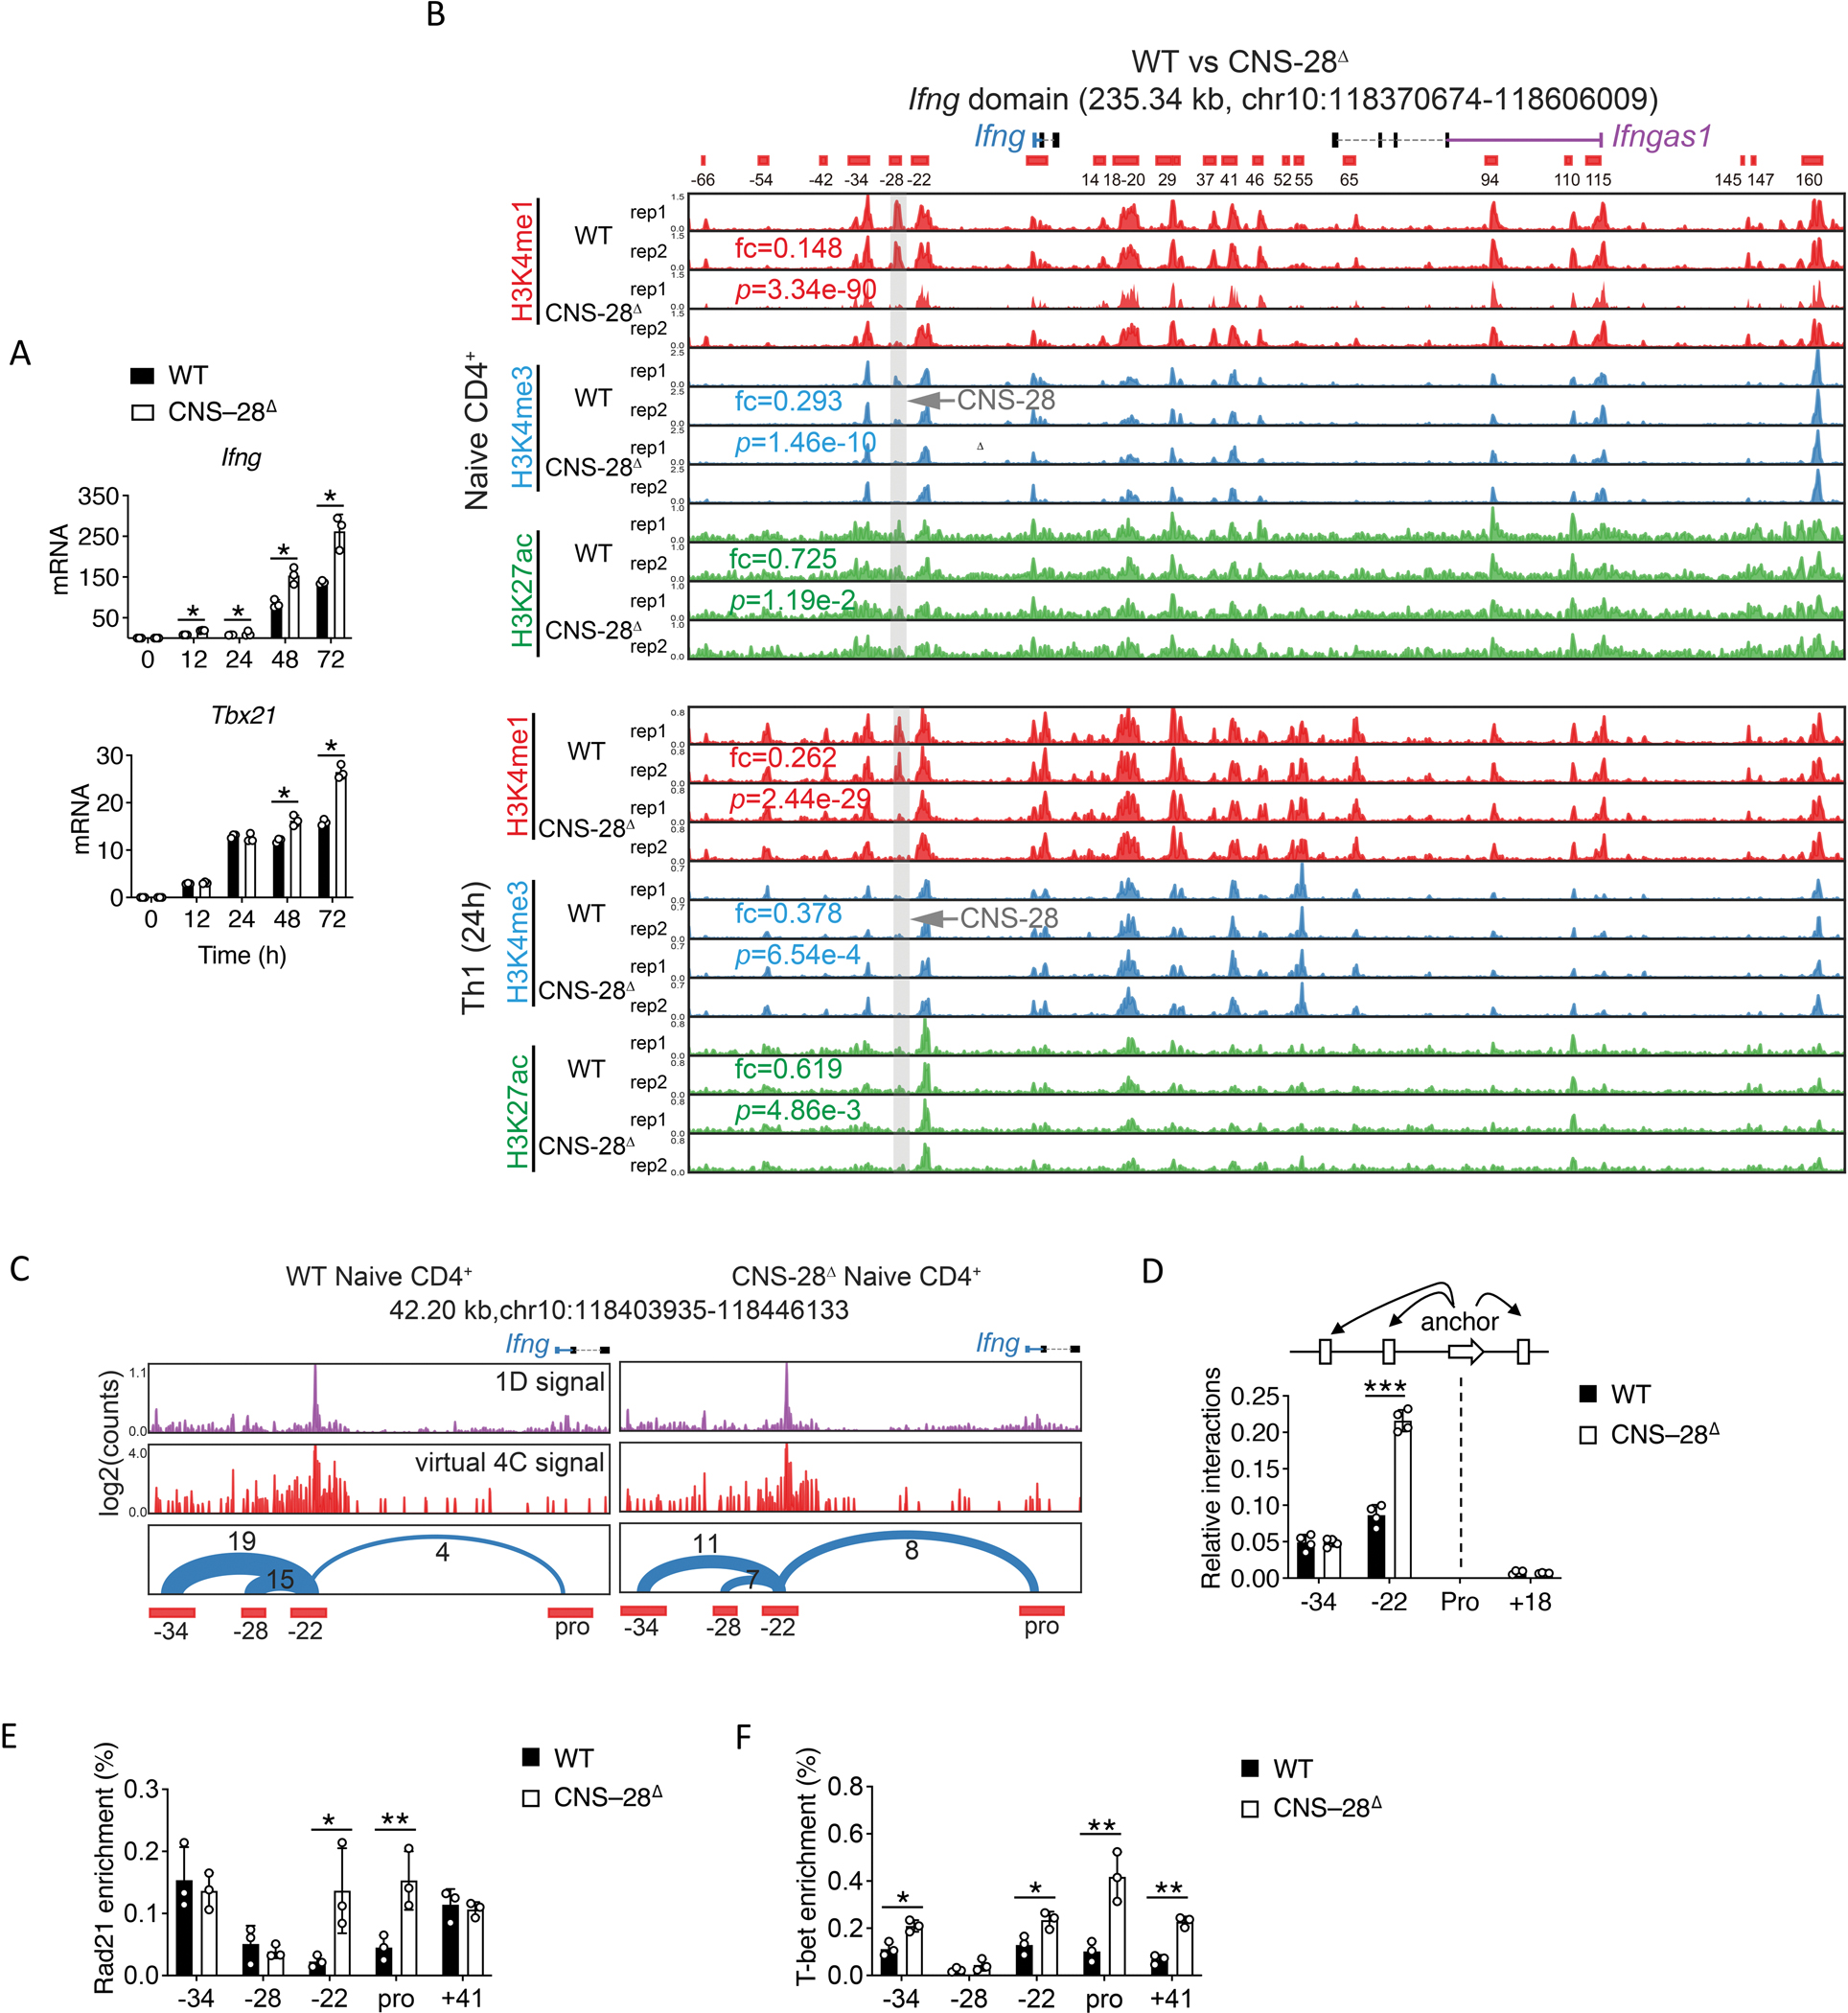
Fig 4. CNS–28 represses interaction between CNS-22 and Ifng promoter.

(A) qPCR analysis of mRNA in WT and CNS–28Δ naïve CD4+ T cells stimulated for 12, 24, 48 and 72 h (horizontal axis) under Th1 conditions; results are presented relative to those of Gapdh.
(B) Genome browser images of H3K4me1, H3K4me3 and H3K27ac ChIP-seq profiles in the Ifng domain. The ChIP-seq data were generated in this study. The mean of normalized reads counts (to a total of 10 million reads) from two replicates of ChIP-seq data in the CNS-28 locus were used to calculate fold changes (KO/WT) and Poisson P-values.
(C) The chromatin interactions originating from CNS-22 detected by Hi-TrAC in WT and CNS–28Δ naïve CD4+ T cells. The high-quality unique PETs from Hi-TrAC libraries were down-sampled to 37 million for a fair comparison between WT and CNS–28Δ cells. CNS–22 was set as the viewpoint for the virtual 4C plots. The number of interacting PETs for each chromatin loop is shown above the arches. The cLoops2 plot module generated the plots.
(D) 3C-qPCR analysis of interaction intensity between the Ifng promoter and other indicated elements in WT and CNS–28Δ Th1 cells. The cartoon above the data indicates the fixed anchor fragment (dashed black lines) and other Hpa I fragments used for the assay.
(E-F) ChIP-qPCR analysis of the binding of (E) Rad21 or (F) T-bet to the Ifng locus in WT or CNS–28Δ Th1 cells, presented relative to input.
Data are representative of at least two independent experiments (A-F). *p < 0.05, **p < 0.01, ***p<0.001, NS: not statistically significant. (Two-way ANOVA with Tukey’s multiple comparison test, error bars, SD).
