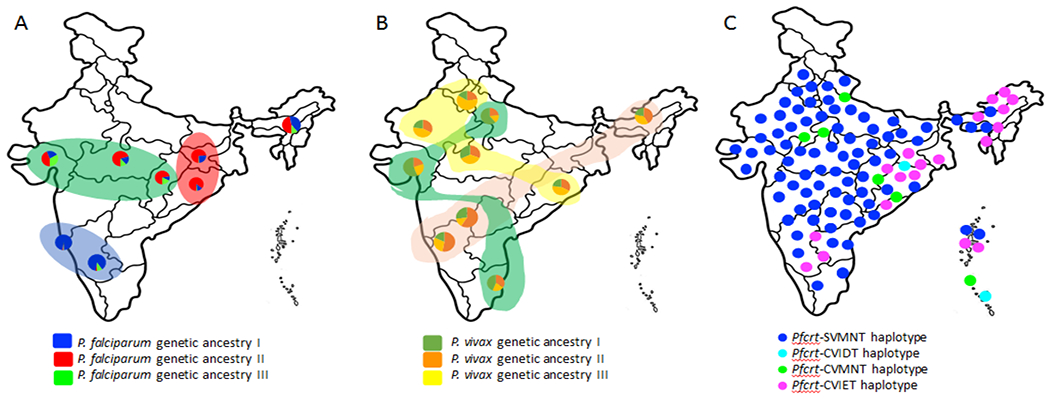
Figure 3. Differential population genetic structure of the two widely distributed malaria parasites (P. falciparum and P. vivax) in India inferred with neutral DNA sequence polymorphisms (A and B) and distributional prevalence of four different haplotypes of the Pfcrt associated with CQ resistance (C).

While P. falciparum (A) displays geographically structured populations (data source: [31]), no such structure could be seen in Indian P. vivax (data source: [32]). (B). The colors in the pie charts (both in A and B) refer to presence of different genetic ancestries of the malaria parasite P. falciparum (A) and in P. vivax (B) in different Indian populations. (C) Graphical representation on the distribution of four major haplotypes of the Pfcrt gene (SVMNT, CVIDT, CVMNT and CVIET) in different regions of Indian P. falciparum [10]. Data not on scale.
