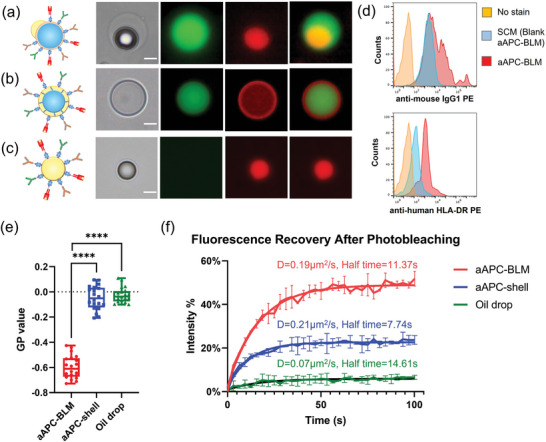
Figure 5.

Fluidity analysis of aAPC‐BLM, aAPC‐shell, and oil drop. Images of a) aAPC‐BLM, b) aAPC‐shell, and c) functionalized oil drop. The green color is the FITC inner phase, and the red color is the rhodamine‐conjugated lipid. a) In aAPC‐shells, the inner phase is well encapsulated and evenly surround by the lipids. The lipids are shown as red rings. b) In aAPC‐BLMs, the inner phase is surrounded by lipid bilayers, which is too thin to be visualized. The oil cap is shown as a red dot that is not completely spherical. c) Oil drops can be identified by the red sphere without the inner phase. Scale bar = 10 µm. d) The intensity of the anti‐mouse IgG1 PE and anti‐human HLA‐DR PE. e) The fluidity of lipid bilayer, oil sell, and oil drop measured by LAURDAN generalized polarization (GP) value. A lower GP value refers to higher fluidity. N = 20 for each condition. A two‐tailed, unpaired t‐test was applied. ****: p‐value < 0.0001 (extremely significant). f) Fluorescence recovery after photobleaching (FRAP). The mobile fraction of aAPC‐BLM, aAPC‐shell, and oil drops are 48.69%, 22.57%, and 5.84%, respectively. N = 2 for each condition.
