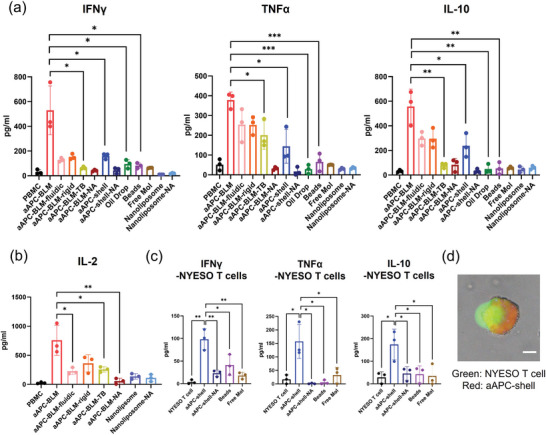
Figure 6.

Analysis of a) IFNγ, TNFα, IL‐10, and b) IL‐2 in the supernatant after co‐culturing the test articles with PBMC for 5 days. c) Cytokine secretion of NYESO‐specific CD8 T cells after 5 days of incubation with aAPC‐shell or control groups. d) CFSE‐stained NYESO‐specific T cell interacting with aAPC‐shell (prepared with 18:1 Liss Rhodamine‐PE). T cell maximized its contact area with the aAPC‐shell, indicating the immune synapse was formed. Scale bar = 10 µm. N = 3. A two‐tailed, unpaired t‐test was applied. ***: 0.0001 < p‐value < 0.001 (extremely significant). **: 0.001 < p‐value < 0.01 (very significant). *: 0.01 < p‐value < 0.05 (significant).
