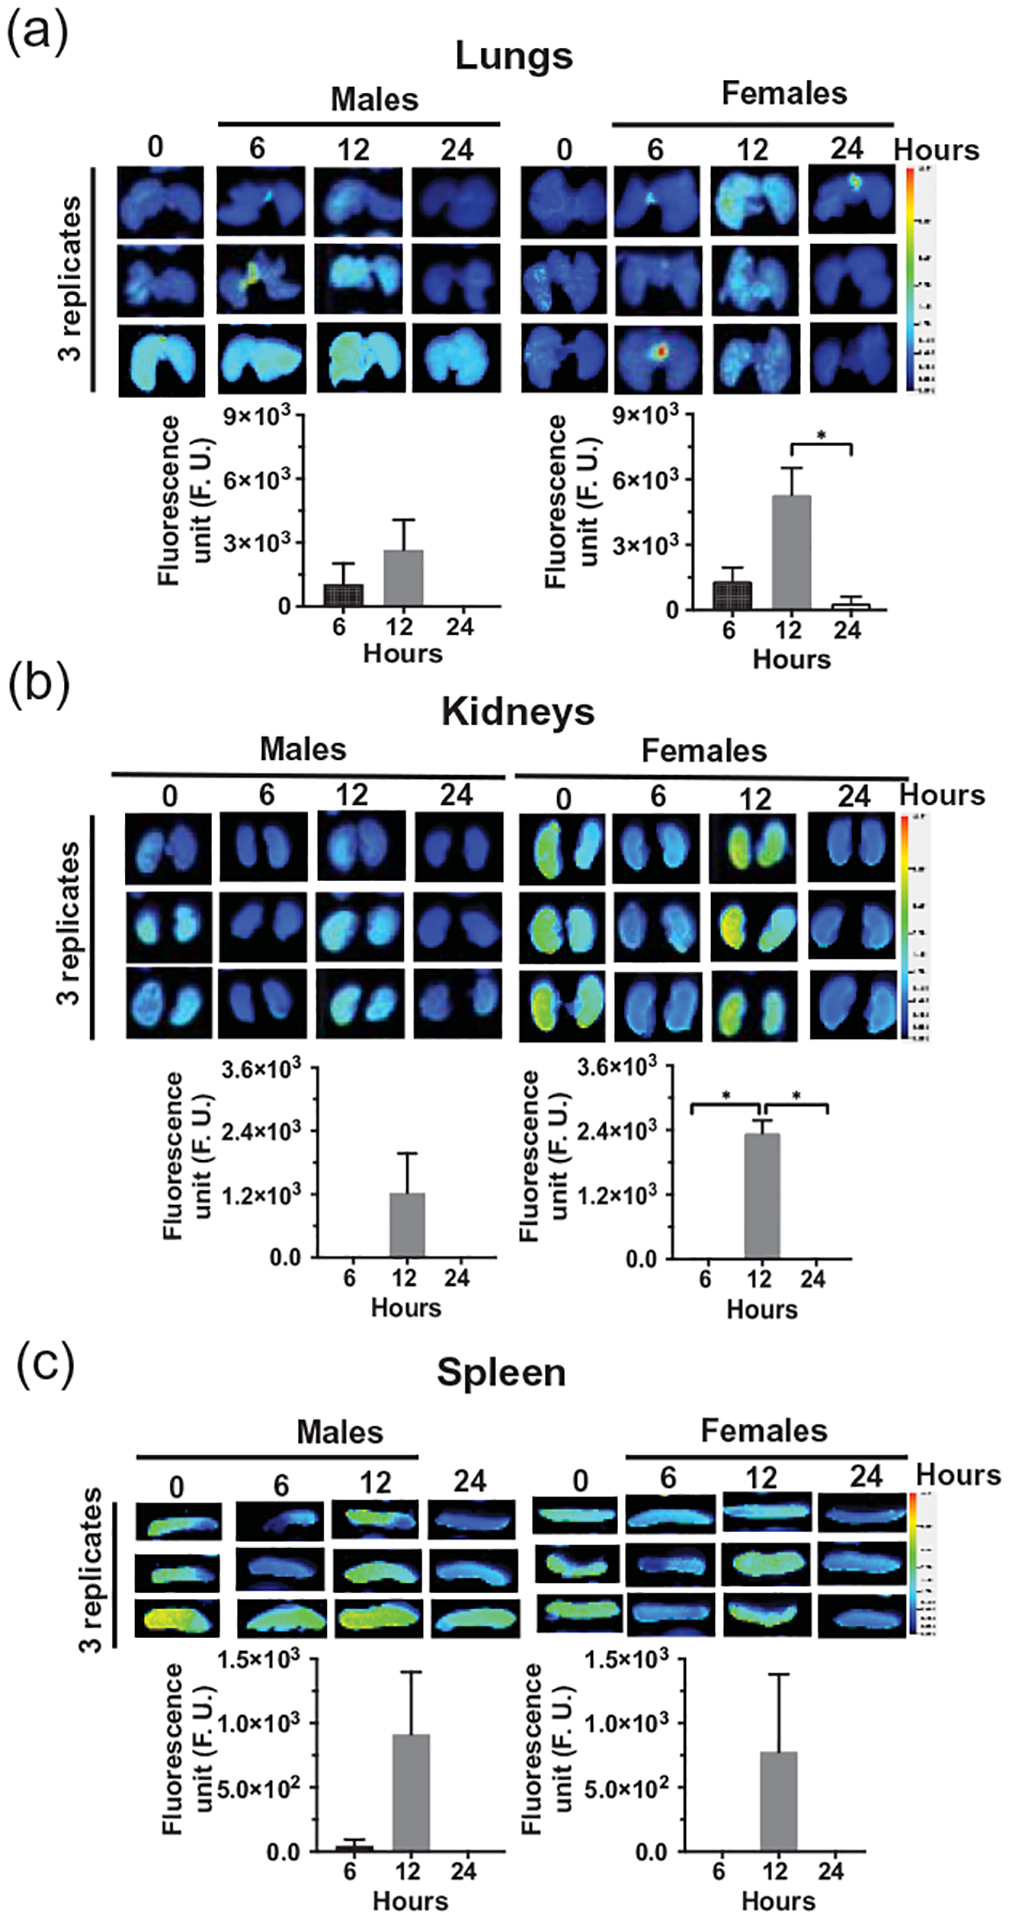
Figure 5: Distribution of orally administered sMEVs in peripheral murine tissues.

Time courses of HiLyte™-labeled sMEVs (MEV-750) fluorescence in tissues. The upper images in panels (a), (b), and (c) show representative examples of time courses of MEV-750 in lung, kidneys, and spleen, respectively, in male and female mice (3 mice per sex). The lower images in panels (a), (b), and (c) show the quantitative analysis of time courses in tissues, normalized by background (time 0 h). Values are expressed as mean ± SEM (*p < 0.05; n = 4 for kidneys and spleen; n = 3 for lung).
