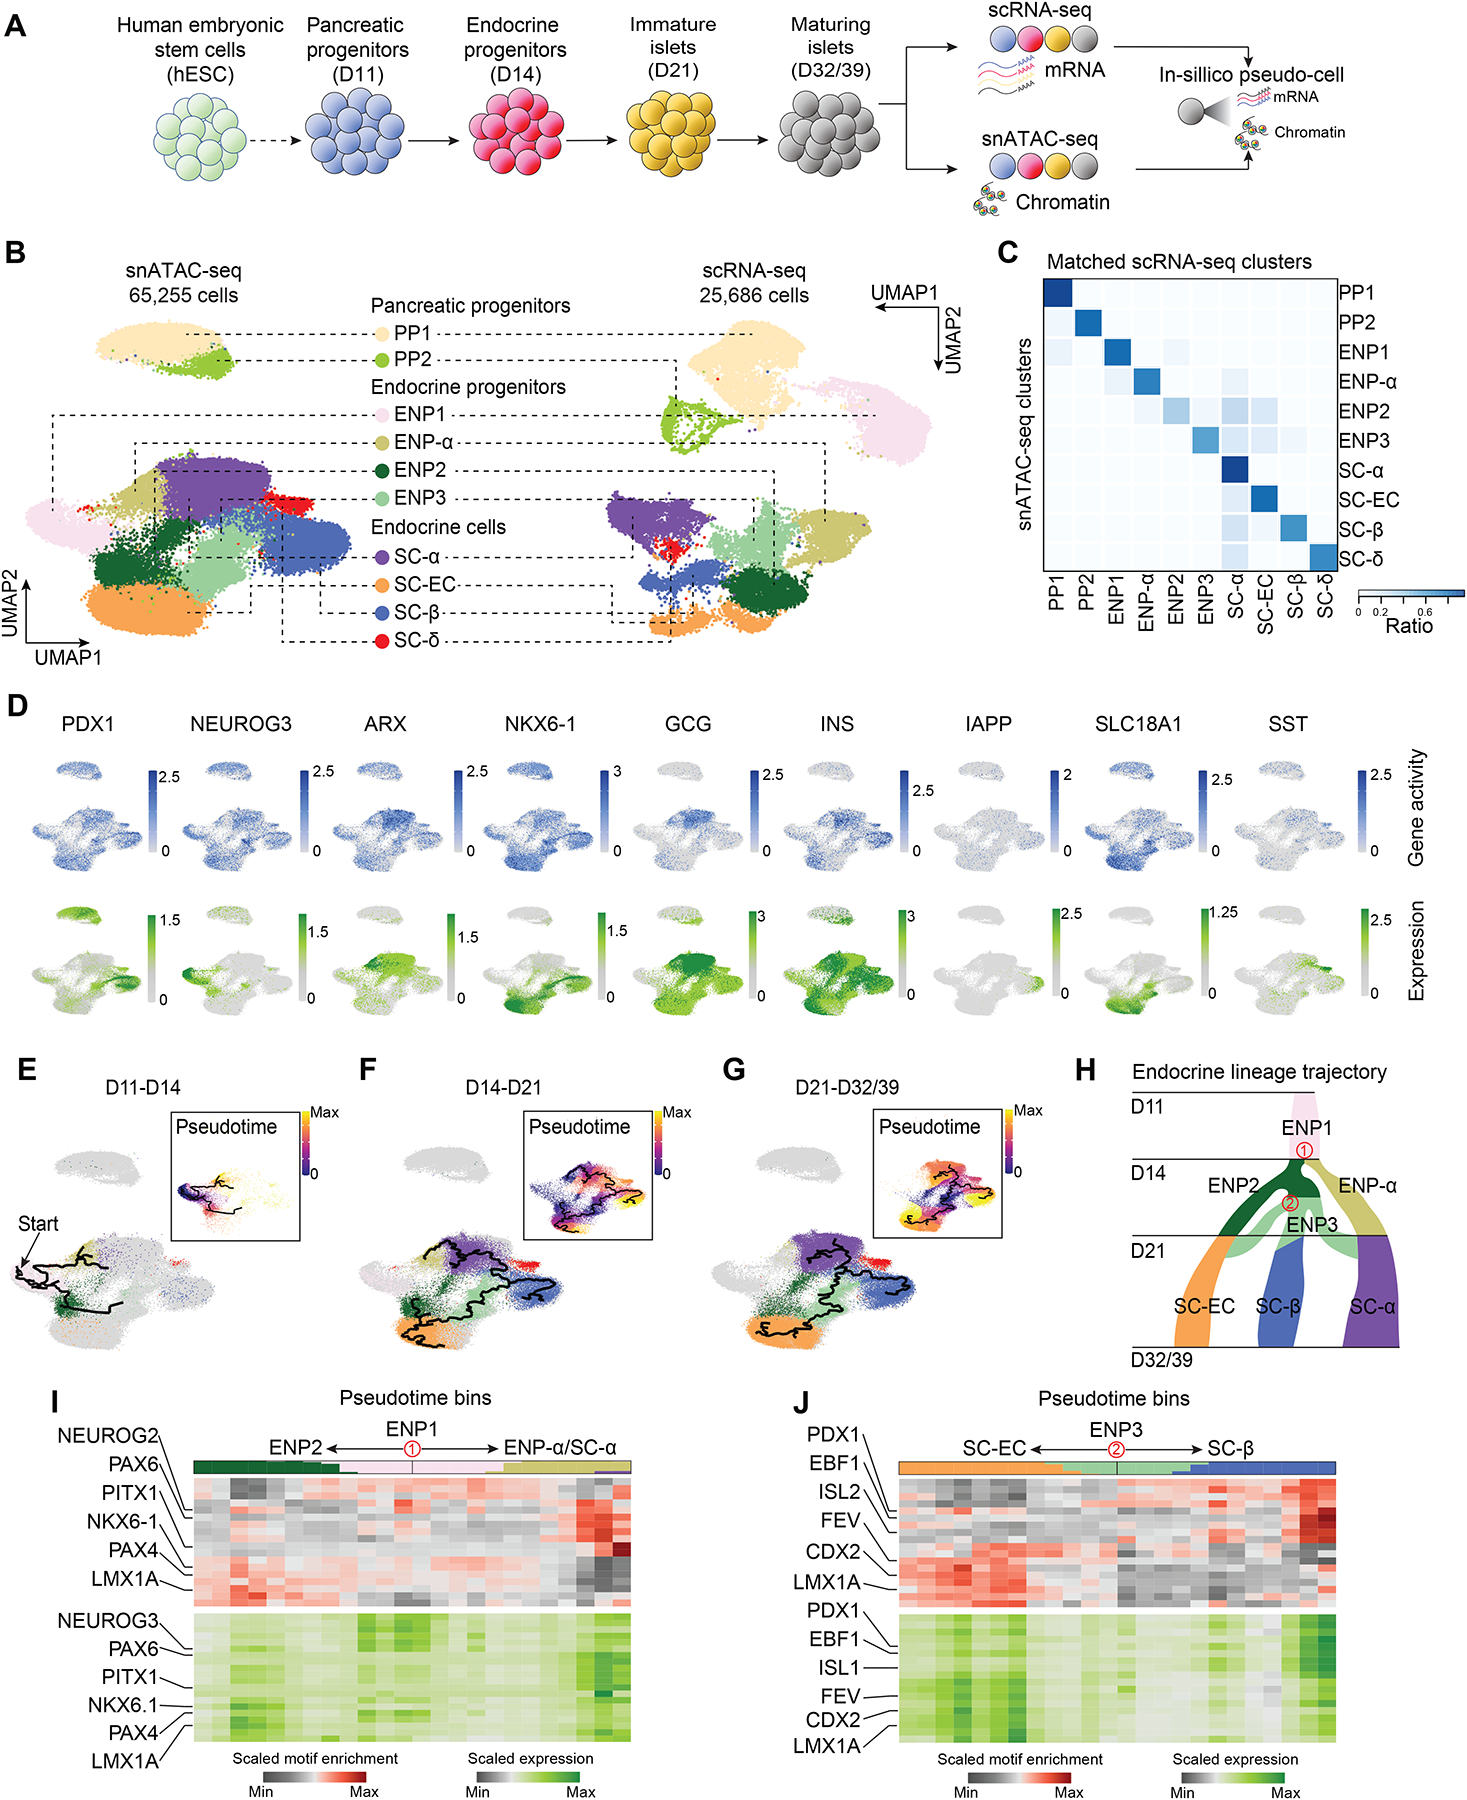
Figure 1. Stem cell islet lineage trajectories based on integrated single-cell chromatin accessibility and transcriptome profiles.

(A) Experimental design. scRNA-seq and snATAC-seq data were generated during SC-islet differentiation at day (D) 11, D14, D21, D32 and D39 and computationally integrated to generate “pseudo-cells”.
(B) UMAP embedding of chromatin accessibility (left) and transcriptome (right) data. Cluster identities were defined by promoter accessibility (snATAC-seq) or expression (scRNA-seq) of marker genes. PP, pancreatic progenitor; ENP, endocrine progenitor; SC-EC, stem cell-derived enterochromaffin cell-like cells.
(C) Heatmap showing ratio of cells with identities in scRNA-seq (column) data matching identities in snATAC-seq (row) data.
(D) Gene activity (top) and gene expression (bottom) for cell type marker genes.
(E-G) Trajectory analysis based on chromatin accessibility, showing trajectories from D11 and D14 (E), D14 and D21 (F), and D21 and D32/39 (G) data with ENP1, ENP2 and ENP3 set as the root, respectively. Cells were color-coded by either cluster identities or pseudotime values (insets). PP1 and PP2 cells were excluded from the analysis.
(H) Inferred endocrine lineage trajectory from e-g. Two branch points (in red) were used in analyses in (I) and (J).
(I, J) Heatmaps of transcription factor motif enrichment (top) and gene expression (bottom) along pseudotime bins downstream of trajectory branch points in (H). Top bar shows proportion of cell types in each pseudotime bin, using matching colors to cell type annotations in (B).
