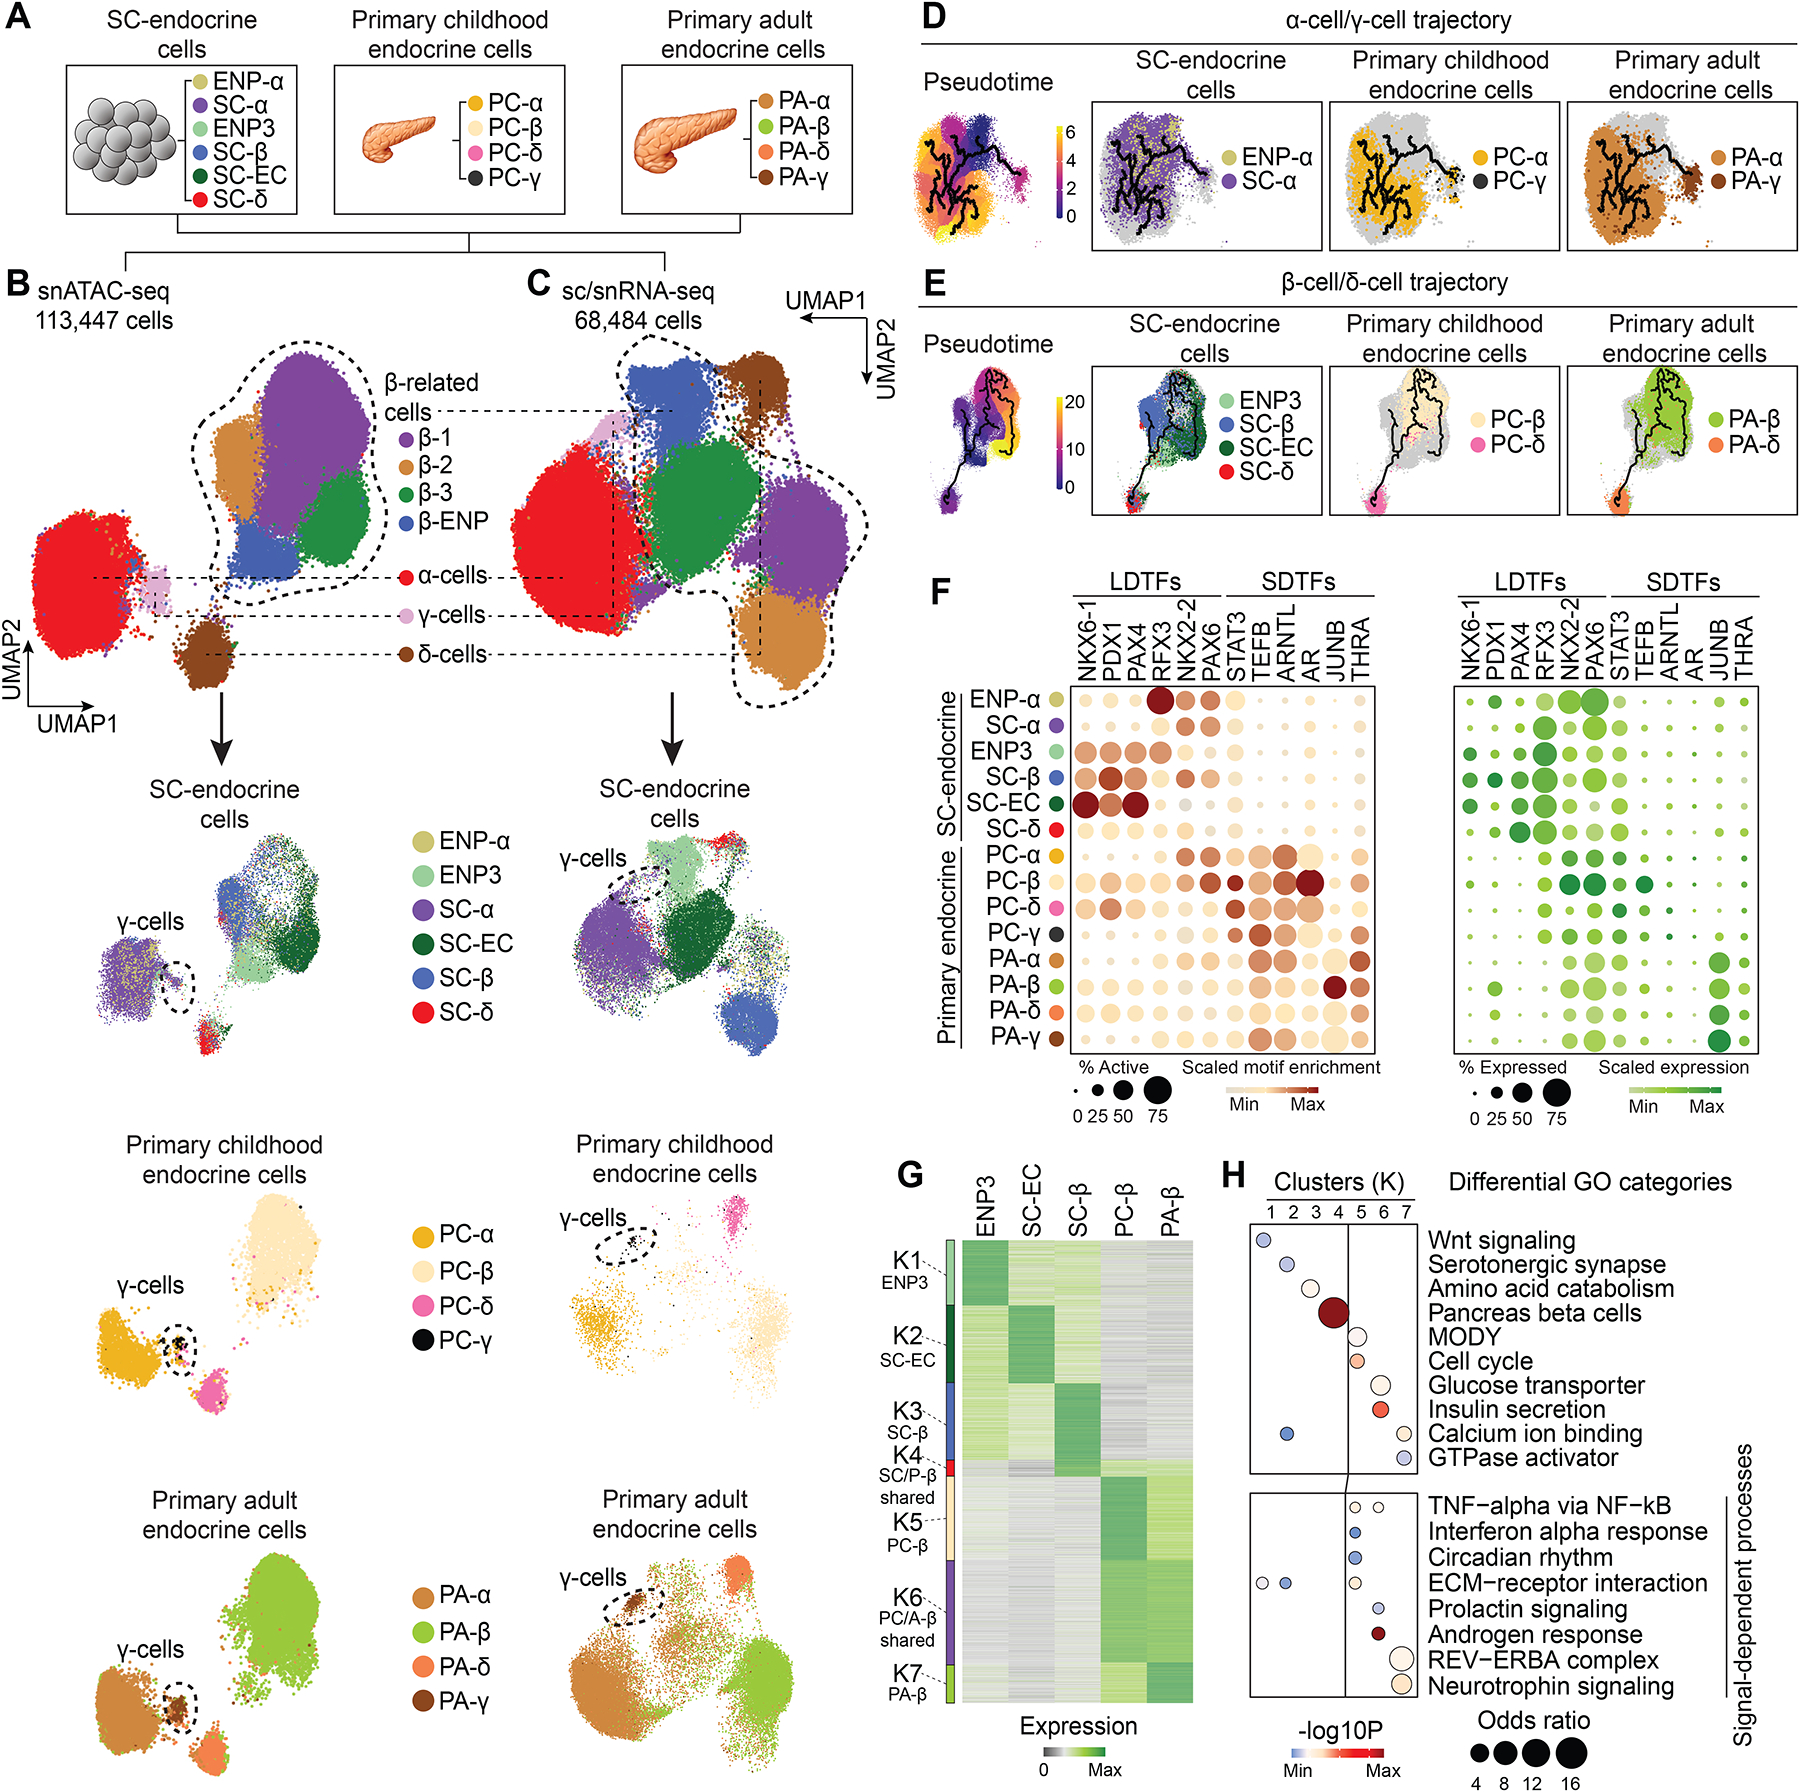
Figure 6. Insufficient activation of signal-dependent gene regulatory programs in stem cell β-cells.

(A) Schematic showing cell types included into the integrative analysis of snATAC-seq and sc/snRNA-seq data.
(B, C) UMAP embedding of chromatin accessibility (B) and transcriptome (C) data from cell types detailed in (A). Cluster identities were defined by promoter accessibility (snATAC-seq) or expression (sc/snRNA-seq) of marker genes. The dashed line outlines β-cell-related cell types. Bottom panels: split UMAPs showing localization of stem cell, childhood and adult pancreatic endocrine cells. Cells were color-coded based on their identities from (A).
(D, E) Trajectory analysis based on chromatin accessibility, showing trajectories for α-cells/γ-cells (D) and β-cells/δ-cells (E) with ENP-α and ENP3 set as the root, respectively. Cells were color-coded by either original identities (A) or pseudotime values.
(F) Dot plots showing scaled average motif enrichment (left) or gene expression (right) of TFs. The color of each dot represents the average motif enrichment or expression level and the size of each dot the percentage of positive cells for each TF. LDTF, lineage-determining TF; SDTF, signal-dependent TF.
(G) K-means clustering of genes with variable expression across β-related cell types (ENP3, SC-ECs, SC-β-cells, PC-β-cells, and PA-β-cells). Clusters were annotated and color-coded based on gene expression patterns.
(H) Enriched gene ontology terms/pathways in each cluster. Significance (−log10 p-value) and odds ratio of the enrichments are represented by color and dot size, respectively.
