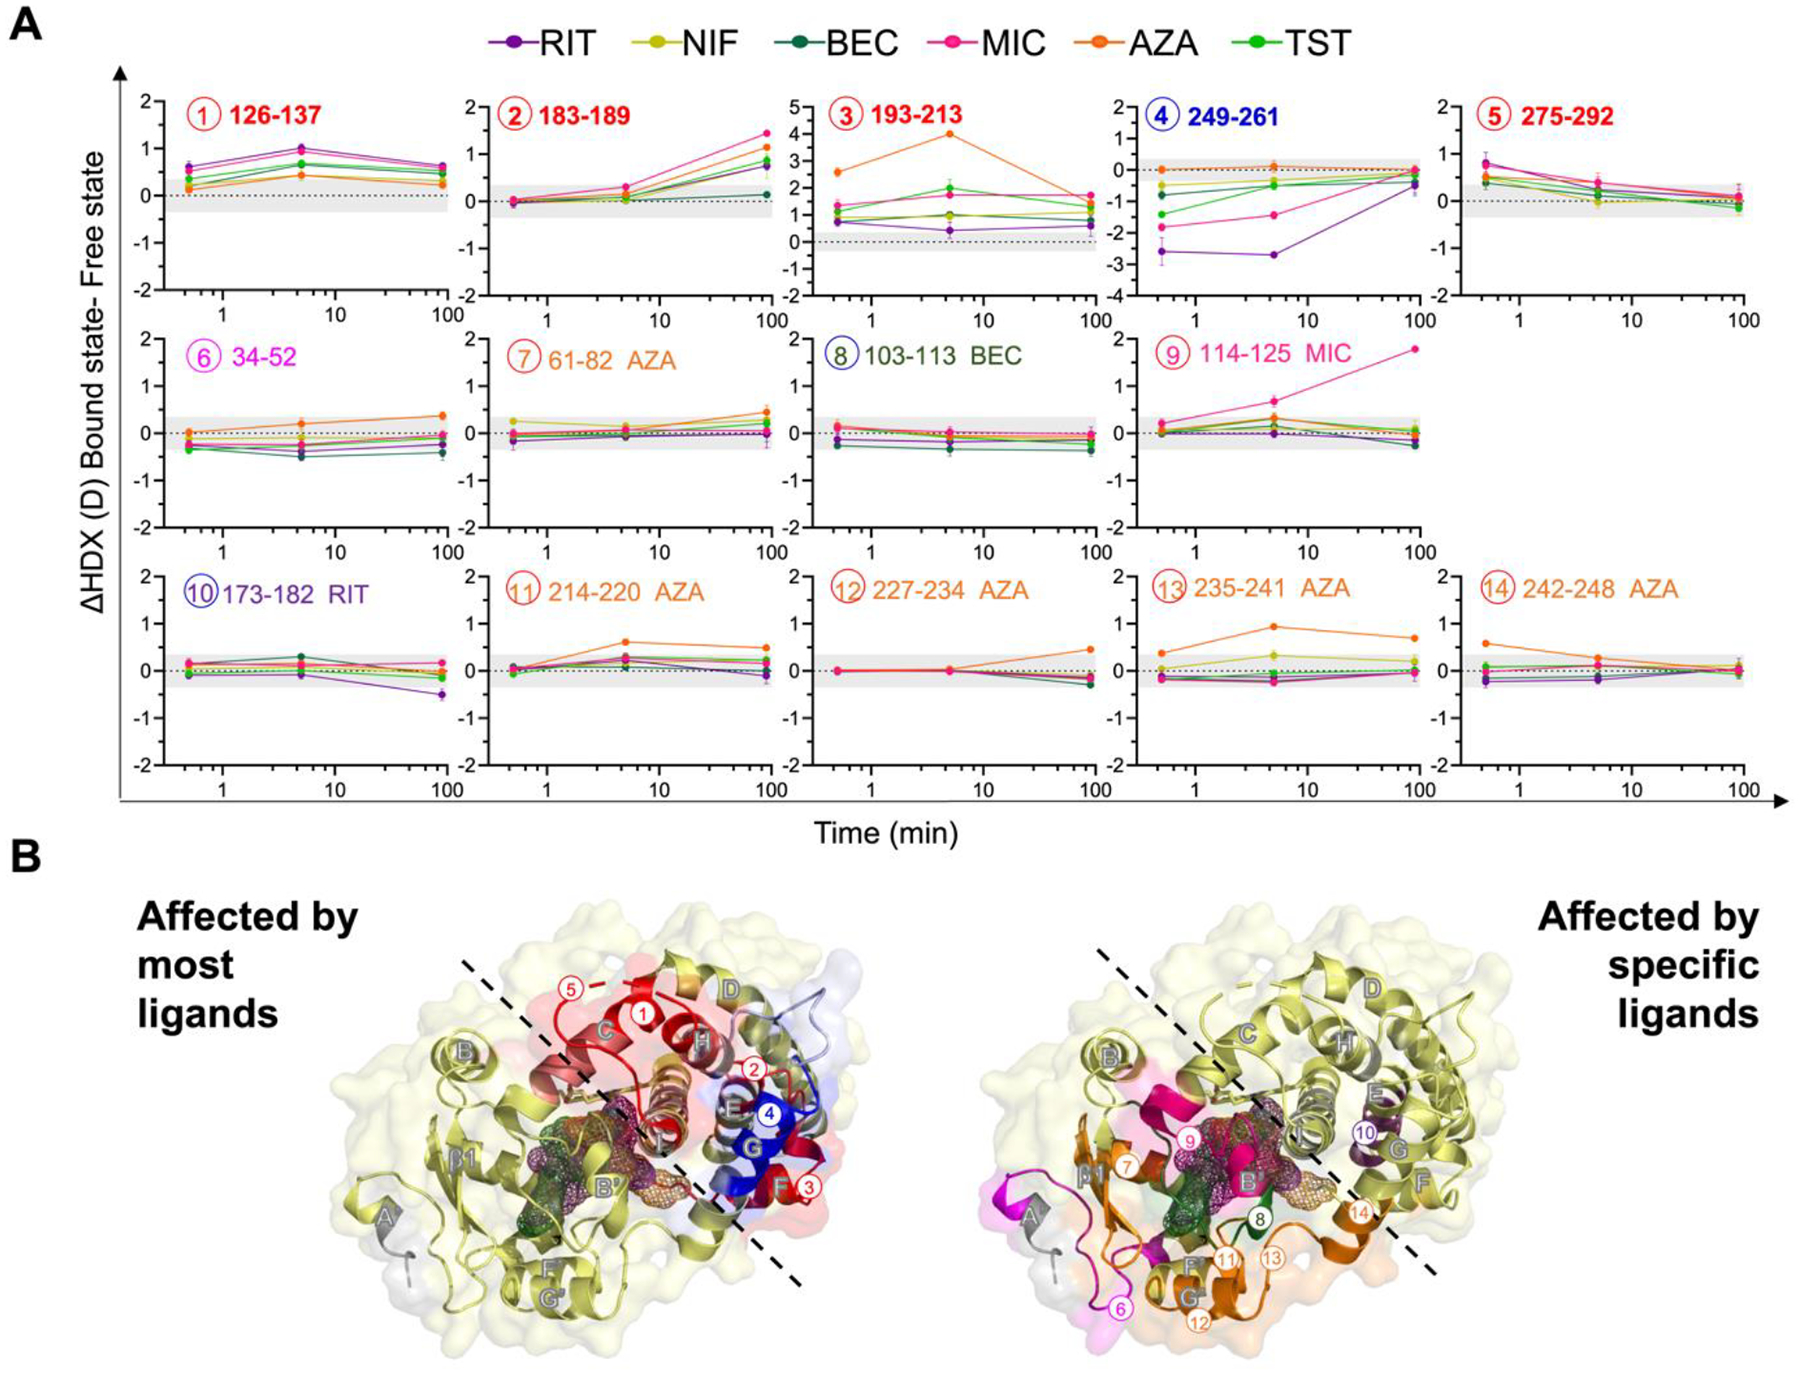
Figure 3. Common vs. unique HDX effects.

A. ΔHDX plots of peptides affected by at least five ligands (in bold), or one ligand. B. Peptides in A mapped onto the crystal structure of CYP3A4 (PDB: 1TQN) represented as a pale-yellow surface and partially visible cartoon. BEC, RIT and AZA are represented as a mesh surface in the active site in dark green, purple and orange, respectively. Uncovered regions are shaded gray. Commonly affected peptides (left) are shaded in red if deprotected and in blue if protected. Peptide 34–52 is in magenta as it is protected for some ligands and deprotected with others. Uniquely affected peptides (right) are shaded according to the color scheme used for each ligand in A.
