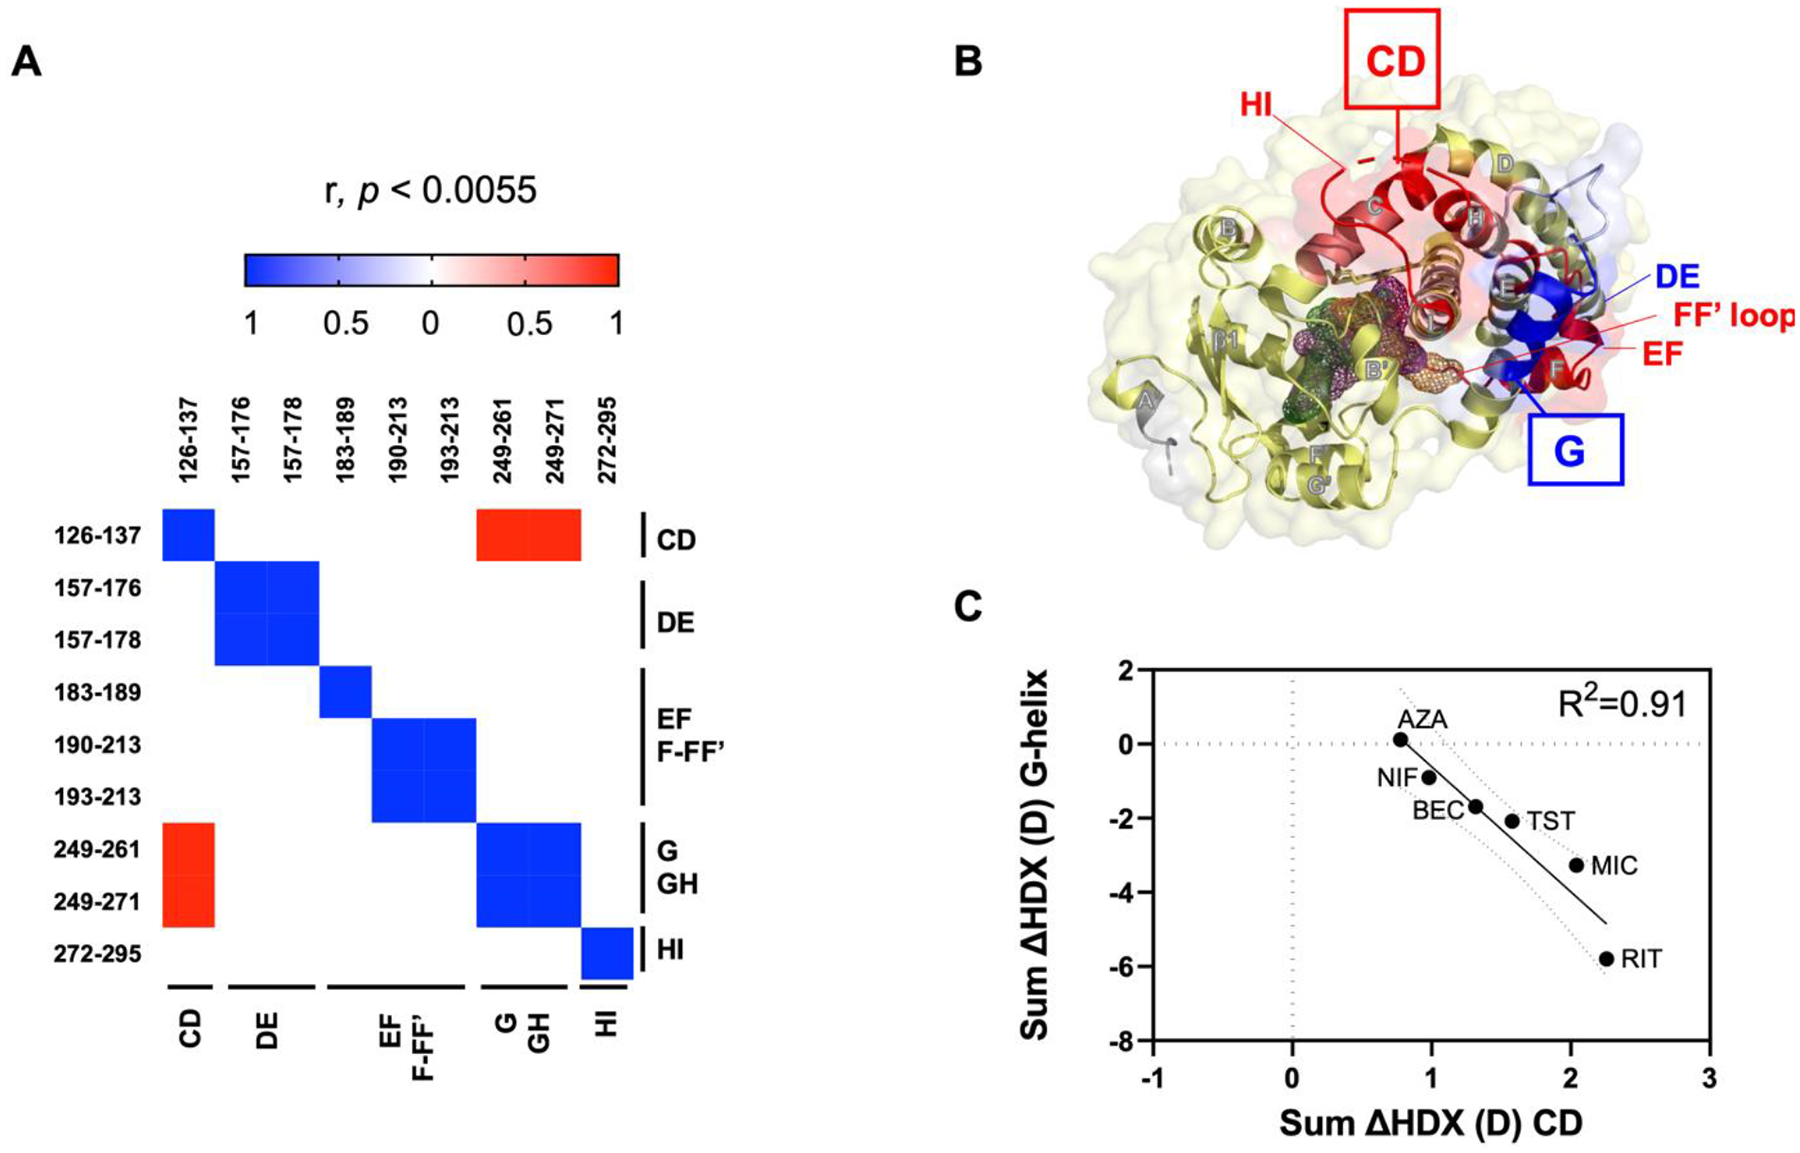
Figure 4. Dynamics of the G-helix are correlated to the C-D region.

A. Correlation matrix heatmap of sum ΔHDX at 30 s, 5 m, and 90 m for peptides that show a significant difference in HDX for at least five ligands. B. Peptides in A mapped onto the 1TQN structure (yellow) in the same color representation as in Figure 3. Only parts of the structure are visible for clarity. The C-D region and G-helix peptides are highlighted with red and blue boxes, respectively. C) Correlation plot of the sum ΔHDX of the C-D region (peptide 126–137) against the sum ΔHDX of the G-helix (peptide 249–261). Dotted lines represent the 95% CI.
