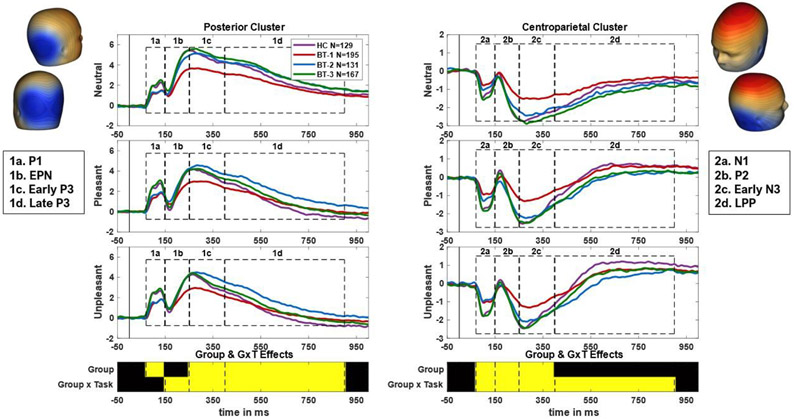
Figure 1. ERP segmentation.
ERPs were constructed from 2 sensor clusters: a posterior cluster and a centroparietal cluster based on scalp distributions of the emotional difference wave (average of pleasant and unpleasant minus neutral response) at EPN and LPP time periods. Headplots of these difference waves are shown on the top left (EPN; negative maximal difference shown in blue at posterior region of scalp) and top right (LPP; positive maximal difference shown in red at centroparietal region of scalp). Components were chosen and named based on their peaks and timing. The P/N1 (1/2a) spans from 70-150 ms, the EPN/P2 (1/2b) spans from 150-250 ms, the early P/N3 (1/2c) spans from 250-400 ms, and the late P3/LPP (1/2d) spans from 400-900 ms. Components are visually separated using dotted lines, with ERPs from neutral, pleasant, and unpleasant scenes depicted in descending order for both clusters. Under the ERPs, a plot shows which components exhibited statistically significant effects of group and group X task interactions. Yellow indicates p<.00625 in omnibus ANOVAs.

