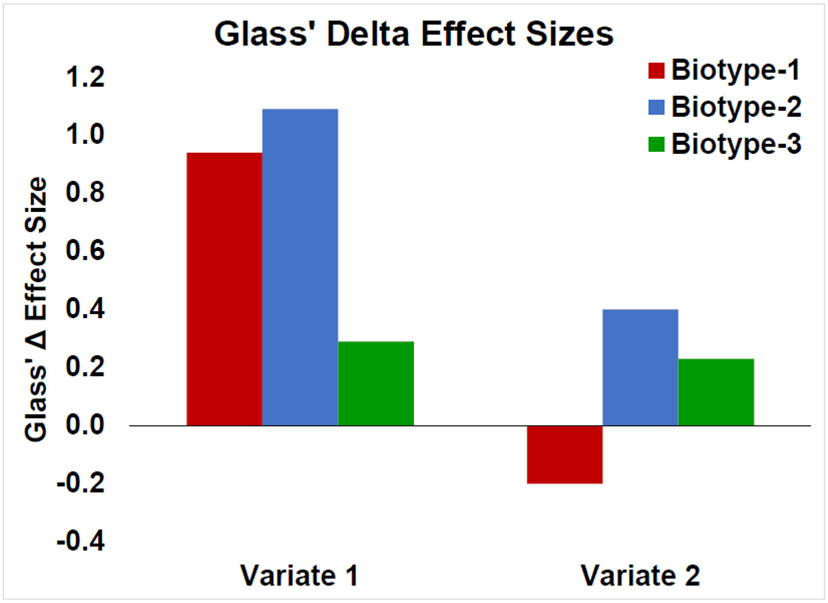
Figure 2. Glass’ Delta effect sizes of CDA variate scores.
The mean of the healthy group is the 0 point on the Y axis. Variate 1 (left) depicts a pattern of differences associated with psychosis & cognitive severity: HC < BT-3 < BT-1/BT-2. Variate 2 (right) separates BT-1 from BT-2 and BT-3, with HC intermediate. Error bars show +/− 1 standard error.

