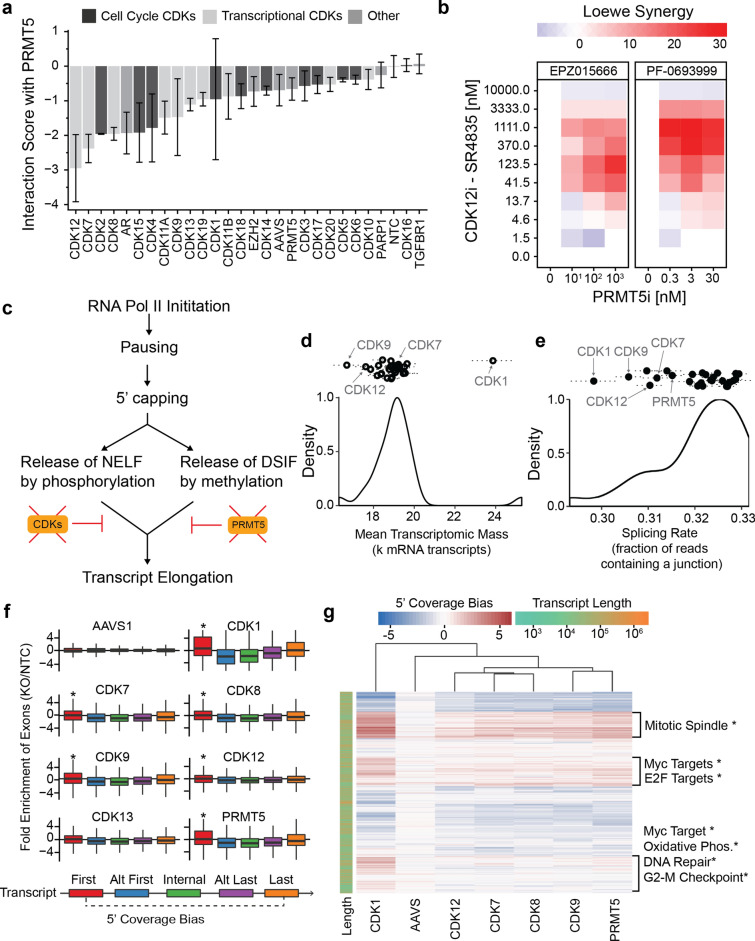
Figure 5.
Relation of PRMT5/CDK synthetic-lethal interactions to aberrant splicing. (a) Genetic interaction score of indicated gene in combination with PRMT5, pooling data from MDA-MB-231, Hs578T, and MDA-MB-468 cell lines as replicates. Error bars represent the standard deviation across all replicates and cell lines. (b) Synergistic inhibition of MDA-MB-231 cell growth with combinatorial treatment of a CDK12 inhibitor (SR-4835) and a PRMT5 inhibitor (EPZ015666 or PF-0693999). (c) CDK proteins and PRMT5 modulate transcript elongation. (d) Mean number of transcripts observed in cells impacted by each gene knockout. The dotted lines represent the standard error of the mean. (e) Splicing rate observed across single cells impacted by each gene knockout. Dotted lines span the standard error of the mean. (f) Log2-fold coverage of exon positions (colors) in transcripts from cells harboring specific gene knockouts (subplots). Data are normalized against data from cells harboring non-targeting-control guides (*p < 0.05, t-test compared to AAVS). (g) Heatmap showing the 5′ coverage bias (first exon relative to last exon) for each gene (row) under select gene knockouts (columns). The most enriched biological functions (MSigDB Hallmark gene sets) are given for select clusters of genes (*padj < 0.05). Rows and columns are sorted by hierarchical clustering; the dendrogram of rows is not shown. Data in panels (d–g) are from MDA-MB-231 cells.

