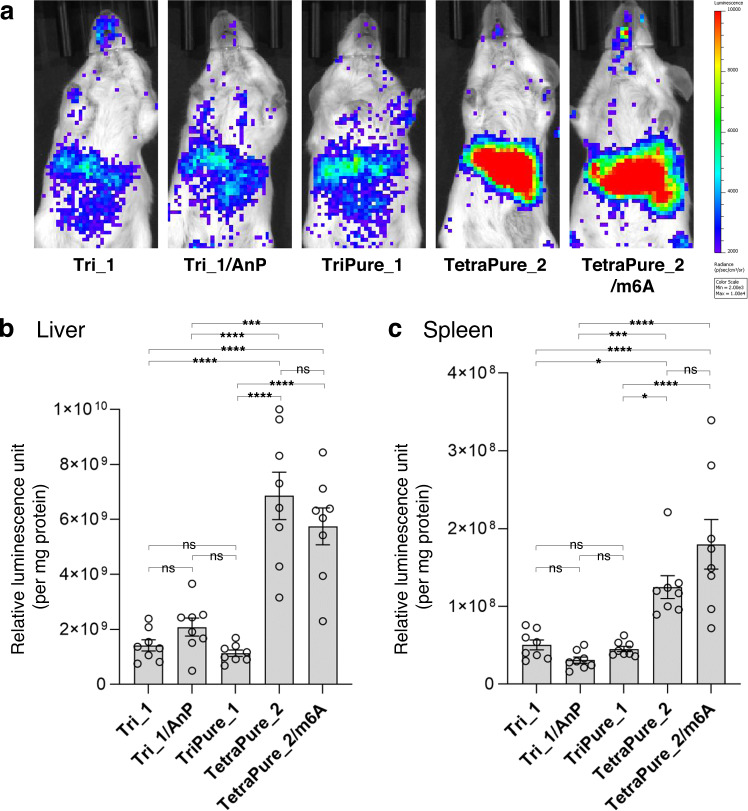
Fig. 8. Translation activity of 650-nt Nluc mRNA in mice.
The expression level of Nluc was evaluated four hours after intravenous injection of mRNA lipid nanoparticles (LNPs) into mice. The cap analog used for mRNA preparation is indicated in the Figure. AnP means the mRNA was further treated with Antarctic phosphatase. (a) In vivo images of mice. (b, c) Quantifying Nluc expression levels using homogenates of the liver (b) and spleen (c). Data are mean ± s. e. m. for biological replicates (n = 8). The statistically significant differences in one-way ANOVA followed by Tukey’s test were marked as follows: ns, p > 0.05 (not significant); *, p < 0.05; **, p < 0.01; ***, p < 0.001, ****, p < 0.0001. (a‒c) Each experiment was repeated independently at least twice to obtain similar results. Source Data are provided with this paper.

