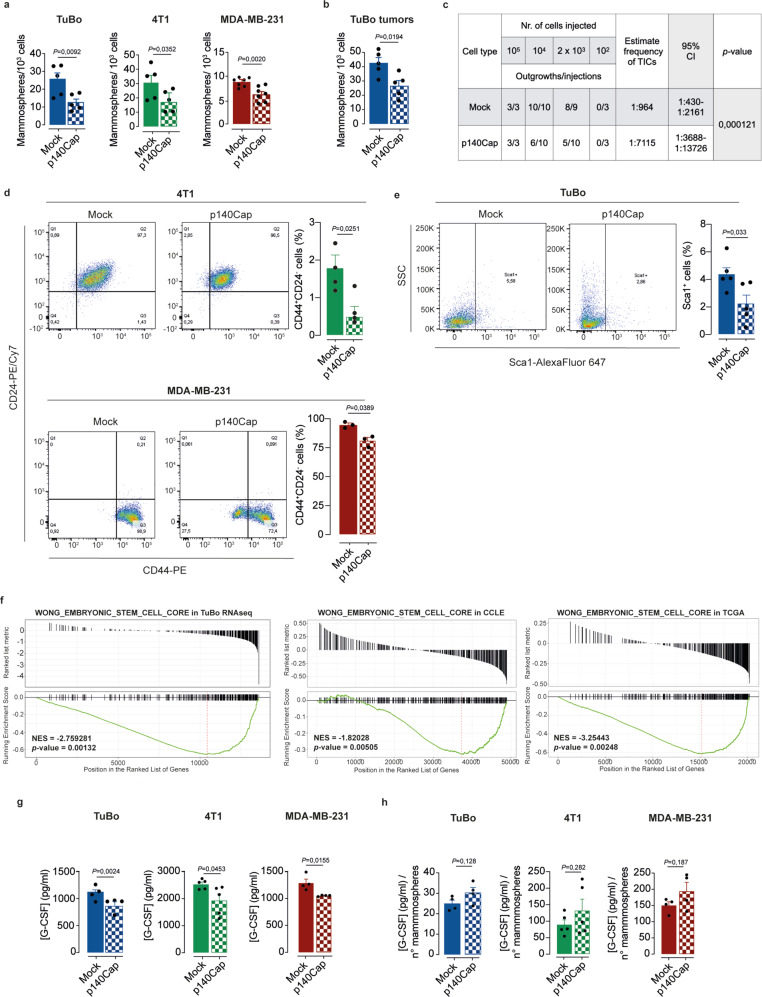
Fig. 5. p140Cap impairs the breast TICs compartment.
a, b p140Cap effects on the Tumor-Initiating Cell (TIC) compartment. Mammosphere formation assay from panel (a) mock and p140Cap TuBo (n = 5), 4T1 (n = 5) and MDA-MB-231 (n = 7) cells and from panel (b) mock and p140Cap TuBo tumors (n = 5). Bar plots of mammosphere numbers are shown. Data are represented for n = x experimental repeats and shown as mean ± SEM; two-tailed unpaired t test). c In vivo Limiting Diluition Assay (LDA) of mock and p140Cap TuBo cells. Decreasing amounts (105, 104, 23 and 102) mock and p140Cap TuBo cells were injected into the mammary fat pad of 8-weeks-old female BALB/c mice. Tumor onset was monitored for 5 weeks post-transplantation. The Extreme Limiting Dilution Analysis (ELDA) software was used to calculate the LDA frequencies estimating the number of stem cells in the bulk population in mock and p140Cap TuBo tumors. d, e FACS analysis of stem cell/TIC markers. d FACS analysis of CD44+/CD24− cell populations in mock and p140Cap 4T1 (n = 4) and MDA-MB-231 (n = 3) cells. e FACS analysis of Sca1 expression in TuBo mock and p140Cap cells (n = 5). Bar plots of TIC marker quantification are shown. Data are represented for n = x experimental repeats and shown as mean ± SEM; two-tailed unpaired t test. f GSEA32,33 plot of WONG_EMBRYONIC_STEM_CELL_CORE in TuBo RNAseq data, and in the CCLE56 and TCGA34 database. The plots show the distribution of genes correlated or not with SRCIN1 gene expression; two-tailed unpaired t test. g G-CSF protein levels in mammosphere supernatants. G-CSF protein levels were measured in mock and p140Cap TuBo (n = 4), 4T1 (n = 5) and MDA-MB-231 (n = 4) mammosphere culture supernatants by ELISA. Data are represented for n = x experimental repeats and shown as mean ± SEM; two-tailed unpaired t test. h Bar plot represent the normalization of G-CSF (pg/ml), shown in panel (g), on mammosphere number generated from mock and p140Cap TuBo (n = 4), 4T1 (n = 5) and MDA-MB-231 (n = 4) cells shown in panel (a). Data are represented for n = x experimental repeats, two-tailed unpaired t test.

