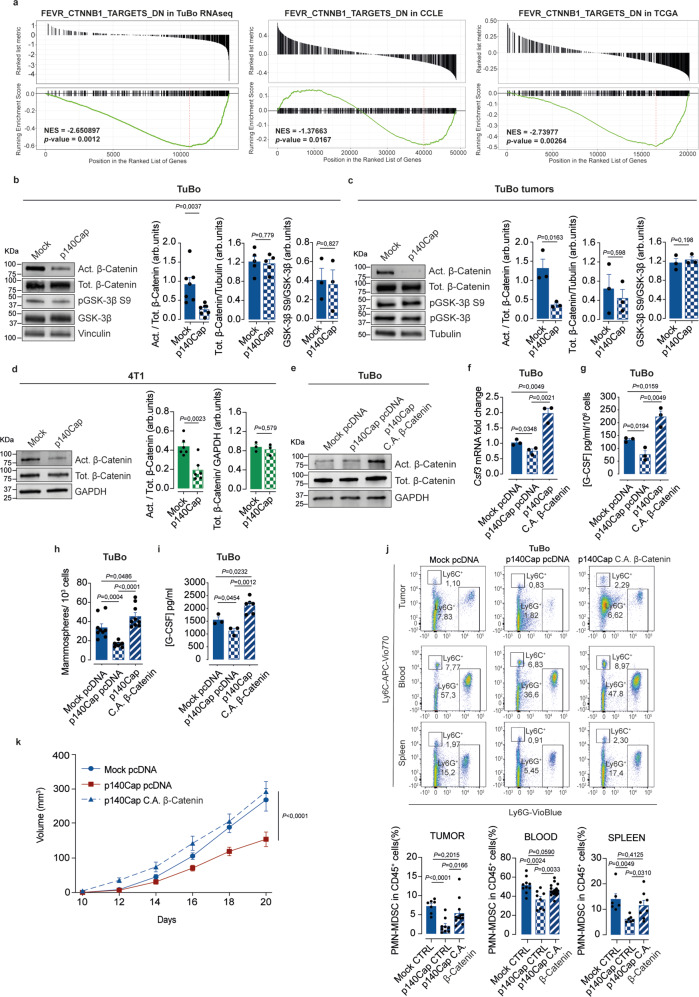
Fig. 6. p140Cap affects the TIC compartment through reduction of the β-Catenin active form.
a GSEA32,33 plot of FEVR_CTNNB1_TARGETS_DN in TuBo RNAseq, CCLE56 and TCGA34 database. Plots show the distribution of genes correlated or not with SRCIN1 gene expression; two-tailed unpaired t test. b–d Effect of p140Cap expression on β-Catenin activation. Immunoblot analysis in mammospheres from (b) mock and p140Cap TuBo cells, (c) tumors. Vinculin,Tubulin and GAPDH were used as loading controls. Act = active β-catenin (n = 7/cells, n = 3/tumors experiments), Tot = Total β-catenin (n = 5/cells, n = 3/tumors), GSK-3β S9 (n = 3/cells and tumors). d mock and p140Cap 4T1 cells. Act = active β-catenin (n = 6), Tot = Total β-catenin (n = 3); arb.units = arbitrary units. Data are representative of n = x experimental repeats and shown as mean ± SEM; two-tailed unpaired t test. In (b) total β-catenin and GSK−3β S9 have been run on a separate blot. In (c) active and total β-catenin have been run on a separate blot. In (d) total β-catenin has been run on a separate blot. e Generation of p140Cap TuBo cells expressing a constitutive active (C.A.) form of β-Catenin or empty pcDNA vector, as control. C.A. expression evaluated by immunoblotting. GAPDH: loading controls. Total β-catenin has been run on a separate blot. Data are represented for n = 3 experimental repeats. f, g C.A. β-Catenin effect on G-CSF expression in p140Cap cells. f G-CSF mRNA by RT-PCR (n = 3) and (g) G-CSF protein levels by ELISA (n = 3). Data are represented for n = x experimental repeats and shown as mean ± SEM; two-tailed unpaired t test. h Mammosphere formation assay from mock pcDNA, p140Cap pcDNA and p140Cap C.A β-Catenin in TuBo cells. Bar plots of mammosphere number are shown. Data are represented for n = 9 experimental repeats; data presented as mean ± SEM; two-tailed unpaired t test. i G-CSF protein levels were measured in mock pcDNA (n = 3), p140Cap pcDNA (n = 3) and p140Cap β-Catenin C.A (n = 6). TuBo mammosphere supernatants by ELISA. Data are represented for n = x experimental repeats and shown as mean ± SEM; two-tailed unpaired t test. j Representative bar plots show the percentage of PMN-MDSC cells normalized on CD45 + cells, in tumor, blood and spleen of mock pcDNA, p140Cap pcDNA and p140Cap C.A β-Catenin. TuBo pcDNA tumor-bearing mice (n = 7/tumor, n = 10/blood, n = 6/spleen); TuBo p140Cap pcDNA tumor-bearing mice (n = 9/tumor, n = 8/blood, n = 6/spleen); TuBo p140Cap C.A β-Catenin tumor-bearing mice (n = 12/tumor, n = 18/blood, n = 8/spleen). Data are represented for n = x mice as mean ± SEM; two-tailed unpaired t test. k C.A. β-Catenin expression on tumor growth. 105 pcDNA (n = 8), p140Cap pcDNA (n = 8) and p140Cap C.A. β-Catenin (n = 13) cells were injected into 8-weeks-old female BALB/c mice. Tumor size was measured every two days. Data are represented for n = x mice as mean ± SEM; 2way ANOVA.

