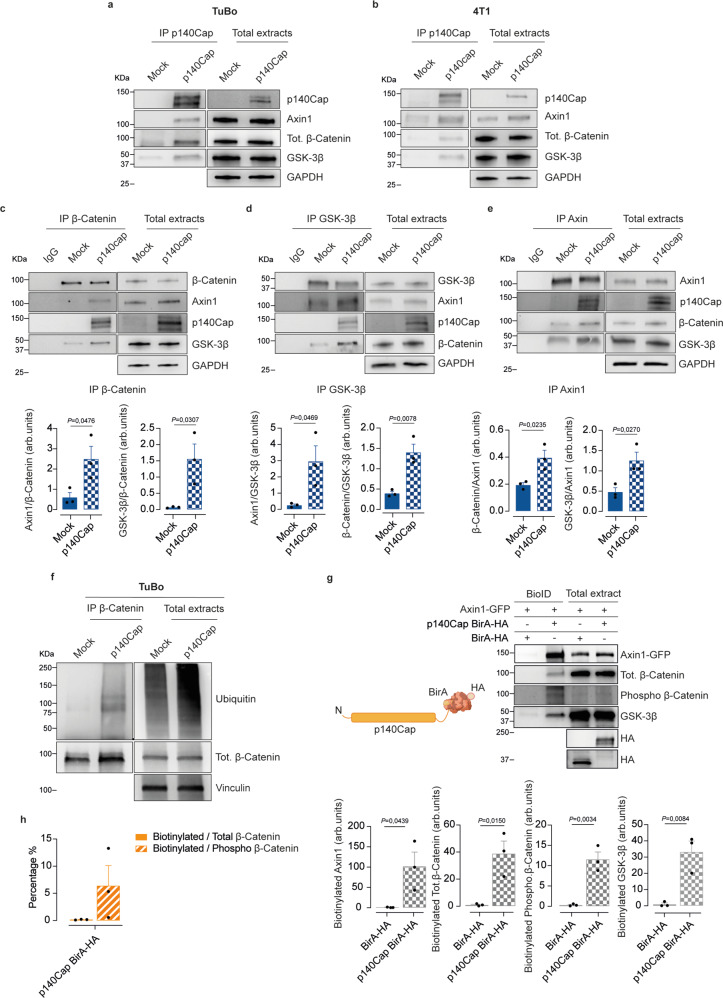
Fig. 7. p140Cap is a component of the destruction complex.
a–e Effect of p140Cap expression on the Destruction Complex stability. a, b Immunoprecipitation of p140Cap and immunoblot analysis with antibodies to β-Catenin, Axin1, GSK−3β in mock vs. p140Cap TuBo in (a) and mock vs. p140Cap 4T1 mammospheres in (b) (n = 3). Data are representative of n = x experimental repeats. c–e Immunoprecipitation of β-Catenin in (c), GSK−3β in (d), Axin1 in (e), or IgG (negative control) from mock and p140Cap TuBo mammospheres, and immunoblot analysis with antibodies to p140Cap, β-Catenin, GSK−3β, and Axin1. Bar plots are represented for n = 3 experimental repeats and shown as mean ± SEM; two-tailed unpaired t test). GAPDH was used as loading control; arb.units = Arbitrary Units. f Immunoprecipitation of β-Catenin from Mock and p140Cap TuBo mammospheres treated with MG132 followed by immunoblot analysis with antibodies to ubiquitin and β-Catenin. Vinculin was used as loading control. Data are represented for n = 3 experimental repeats. g BioID assay in HEK293 cells. Extracts from HEK293 cells transfected with p140Cap-BirA-HA and BirA-HA constructs in combination with Axin1-GFP were isolated with the BioID protocol and blotted with antibodies to Axin1, Total β-Catenin, Phospho β-Catenin, GSK-3β and HA. BirA-HA construct was used as negative control. Data are represented for n = 3 experimental repeats; bar plot represent biotinylated protein normalized on HA transfected amount as mean ± SEM; two-tailed unpaired t test. h Bar plot represents the percentage of biotinylated total or Phospho β-Catenin normalized on the total amount of total or Phospho β-Catenin, respectively. Data are represented for n = 3 experimental repeats and shown as mean ± SEM; two-tailed unpaired t test.

