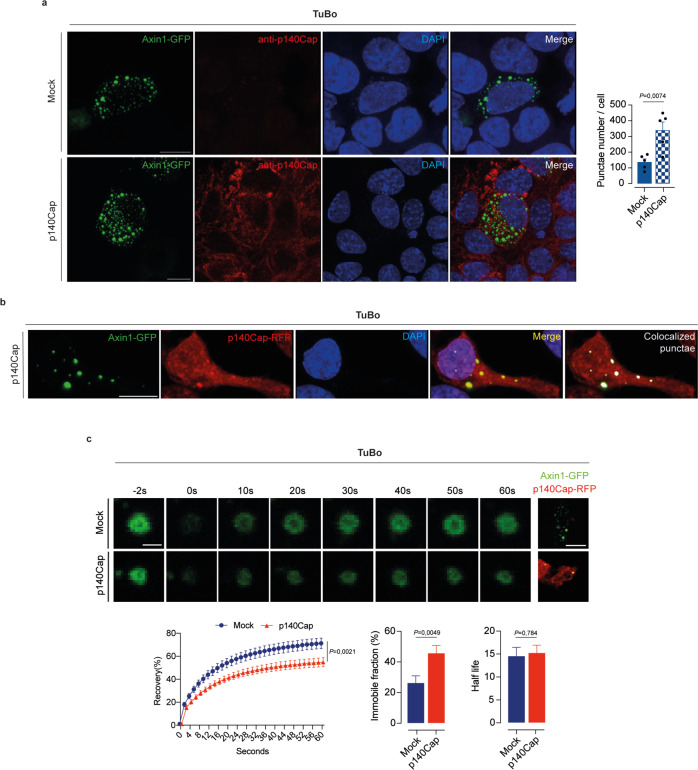
Fig. 8. p140Cap controls the stability of the destruction complex.
a Confocal images showing the number of Axin1-GFP punctae in Mock and p140Cap-TuBo cells. The nuclei were counterstained by DAPI. Scale bar 10 μm. Data are representative of n = 5 experimental repeats and shown as mean ± SEM; two-tailed unpaired t test. b Confocal images showing the colocalization of Axin1-GFP and p140Cap-RFP in punctae in Mock-TuBo cells co-transfected with Axin1-GFP and p140Cap-RFP. Scale bar 10 μm. Data are representative of n = 5 experimental repeats and shown as mean ± SEM; two-tailed unpaired t test. c Selected frames of FRAP experiments before and after bleaching, and throughout the recovery of Axin1-GFP in TuBo cells transfected with Axin1-GFP alone or in combination with p140Cap-RFP. Immobile fraction and half-life of GFP-Axin1. Scale bar 1 μm and 10 μm. Cell number > 31, data are representative of n = 3 experimental repeats and shown as mean ± SEM; two-tailed unpaired t test; 2way ANOVA for FRAP.

