Fig. 1.
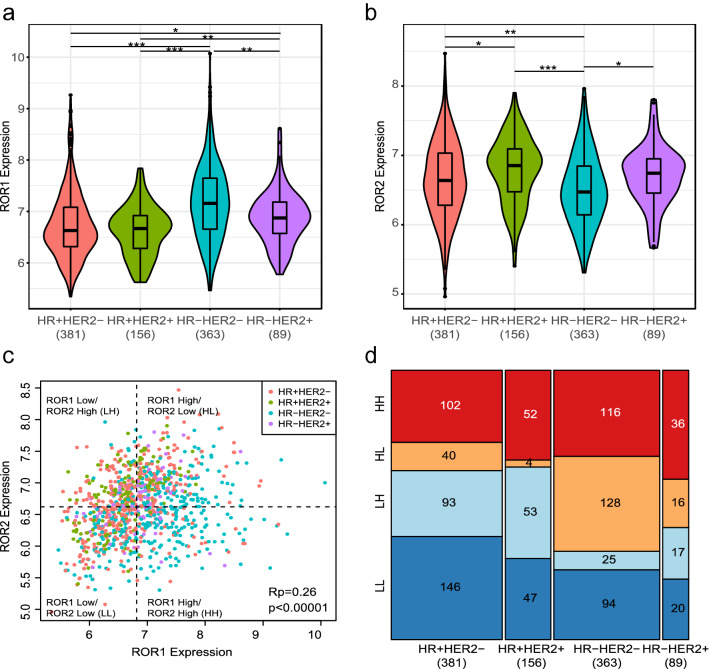
Distribution of ROR1 and ROR2 expression by HR/HER2 subtype. a, b Violin plots of log2-scaled normalized a ROR1 and b ROR2 expression by HR and HER2 status. Asterisks reflects pairwise Wilcoxon-rank sum test p values (*** p < 0.0001, **0.0001 < p < 0.001, *0.001 < p < 0.05). Color denotes receptor subtype (pink: HR + HER2-, green: HR + HER2 +, aqua: HR- HER2-, purple: HR-HER2) c Scatter plot of ROR2 vs. ROR1 expression level. Color reflects receptor subtype (pink: HR + HER2-, green: HR + HER2 +, aqua: HR- HER2-, purple: HR- HER2+). Dotted lines indicate median ROR1 and ROR2 expression values, which were used to define four patient subsets by dichotomized ROR1 and ROR2 expression (ROR1 above median: ROR1-High; ROR2 above median: ROR2-High). d Distribution of dichotomized ROR1/ROR2 expression subsets by HR and HER2 status. Color reflects ROR1/ ROR2 expression groups (red: ROR1-High/ROR2-High (HH); orange: ROR1-High/ROR2-Low (HL); light blue: ROR1-Low/ROR2-High (LH); blue: ROR1-Low/ROR2-Low (LL)

