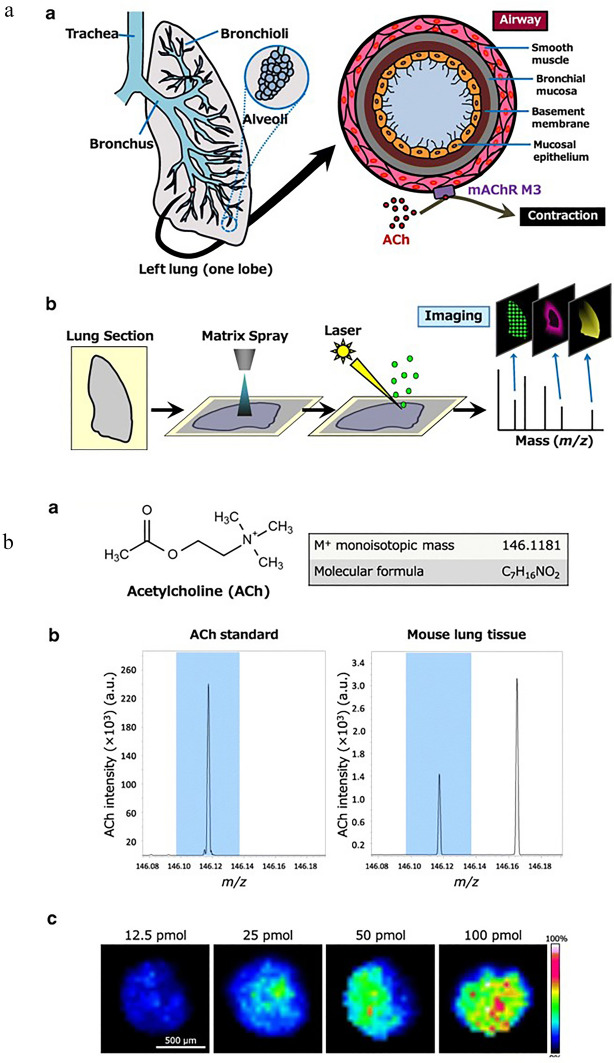
Fig. 13.
a Schematic illustration of the mouse lung anatomy and imaging MS. a—Mouse lung anatomy. b—Imaging MS (IMS), which allows visualization of the distribution and abundance of a target molecule in biological tissue. The figure is from an open access article distributed under the terms of the Creative Commons CC BY license. Copyright © 2020. Springer, Nature. b Signal of ACh and amount-dependent signal intensity. a—ACh chemical structure (the theoretical exact mass is 146.1181). b—Comparison of ACh signal peaks for the standard and lung tissue. c—The ACh abundance dilution of the standard on lung tissue in spots visualized by Fourier transform ion cyclotron resonance mass spectrometry (FT-ICR-MS). The figure is from an open access article distributed under the terms of the Creative Commons CC BY license. Copyright © 2020. Springer, Nature

