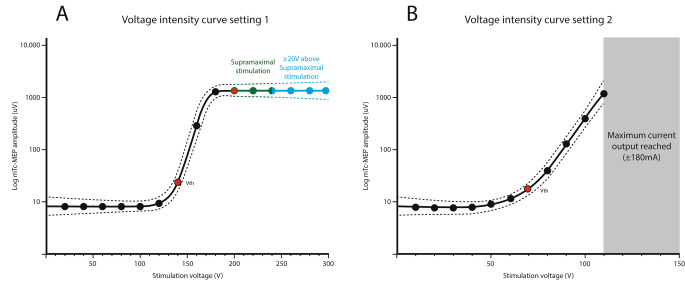
Fig. 1.
Example Sigmoidal Boltzmann curves for setting 1 (A) and setting 2 (B)
The x-axis denotes the stimulation voltage used for eliciting the mTc-MEP amplitude. The y-axis denotes the logarithm of the mTc-MEP amplitude in µV. The graphs are altered from real data
(A) supramaximal stimulation was achieved for setting 1 since a plateau was reached (green). In blue, the voltage intensities with the possibility to increase the voltage intensity with ≥ 20 V is shown
The red dots represent the voltage motor threshold and the voltage intensity at which supramaximal stimulation was achieved (the second log-amplitude of the plateau). (B) Supramaximal stimulation was not reached for setting 2. It was not possible to increase the voltage above 110 V since the maximum current output was reached. The voltage intensity at which the maximum current output was reached differed between patients
Vth Voltage threshold

