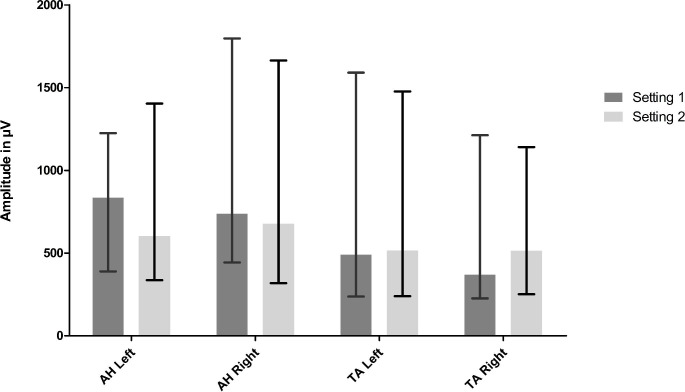
Fig. 2.
Median amplitudes per muscle for setting 1 and setting 2
The x-axis denotes the different muscles used for mTc-MEP monitoring, and the y-axis denotes the median amplitude in µV. The median intraoperative mTc-MEP amplitudes for setting 1 (dark grey bars) and setting 2 (light grey bars) are presented of 25 patients for the AH left and 26 patients for the AH right, TA left and TA right. The whiskers represent the interquartile range (Q1-Q3).
AH abductor hallucis muscle, TA tibialis anterior muscle

