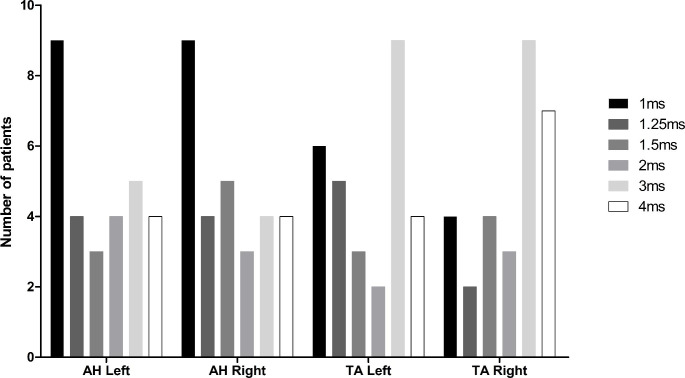
Fig. 4.
Distribution of optimal ISI when measuring mTc-MEPs using supramaximal stimulation with a pulse duration of 0.075ms (n = 29)
The x-axis denotes the different muscles used for mTc-MEP monitoring and the y-axis denotes the number of patients. The optimal ISI’s ranging from 1ms to 4ms are presented by the different colored bars for the AH left, AH right, TA left and TA right separately
AH abductor hallucis muscle, TA tibialis anterior muscle

