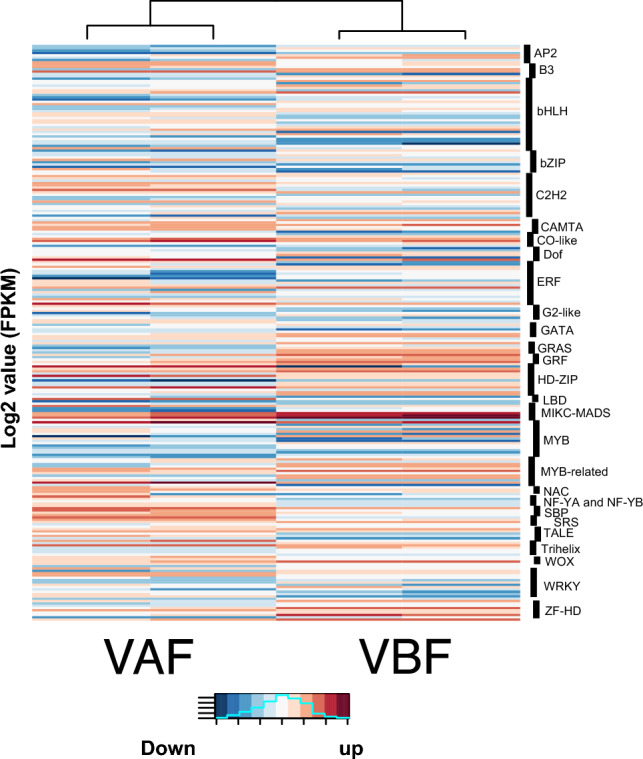
Fig. 5.

Expression of differentially expressed (DE) transcription factors. Heatmap illustrating the differential expression of transcription factor genes of pre-fertilized and post-fertilized chickpea ovule stages. Enriched transcription families are labelled. The color scale at the right shows high and low expressions as red and blue, respectively
