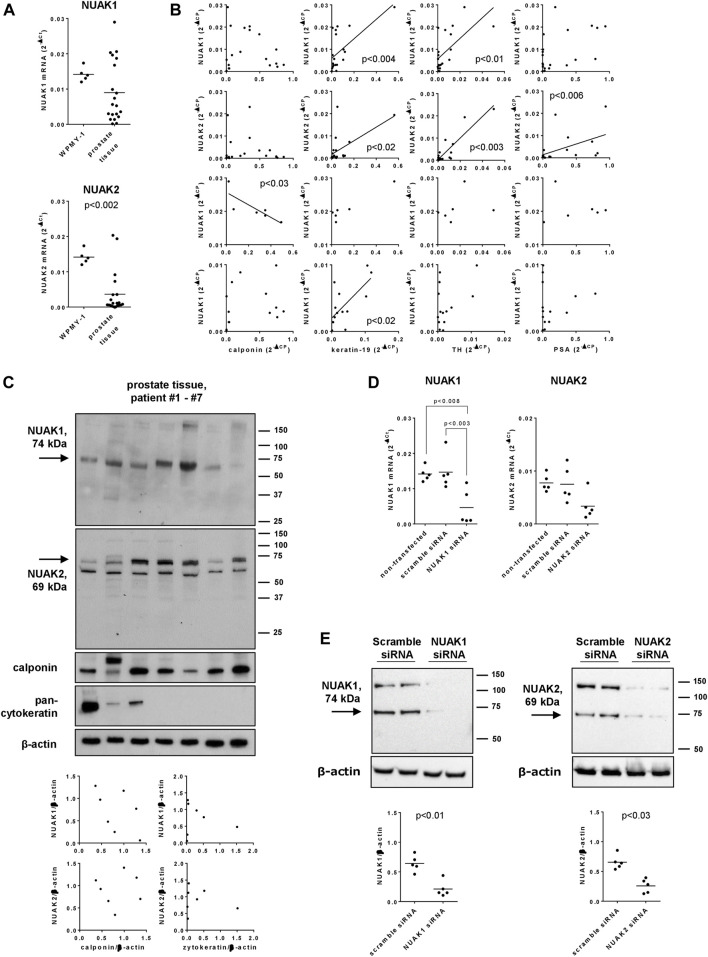
FIGURE 1.
Expression and silencing of NUAK1 and NUAK2 in WPMY-1 cells and human prostate tissues. WPMY-1 cells and human prostate tissues were analyzed for NUAK1 and NUAK2 mRNA by RT-PCR (A,B,D), or by Western blot analysis with antibodies raised against NUAK1 and NUAK2 (C,E). (A) Comparison of NUAK1 and NUAK2 mRNA expression between WPMY-1 cells and human prostate tissues. (B) Correlation analyses, with mRNA levels of NUAK1, NUAK2, calponin (marker for smooth muscle), keratin-19 (marker for glandular, epithelial cells), tyrosin hydroxylase (TH, marker for catecholaminergic neurons) and prostate-specific antigen (PSA, marker for BPH) in human prostate tissue. Ct values for NUAK1 in prostate tissues showed a binominal distribution, so that groups with high (ddCt >0.01) and low (ddCt <0.01) were analyses separately, in addition to analyses with all examined tissues. (C) Western blot analyses of human prostate tissues with NUAK1 and -2 antibodies, and for calponin and pan-cytokeratin. Diagrams show correlation analyses of both NUAK isoforms with calponin and pan-cytokeratin, after quantification of bands in Western blots. Arrows indicate bands with sizes closest to expected molecular weights of NUAKs, which were densitometrically quantified. (D) NUAK1 and NUAK2 mRNA in WPMY-1 cells, after transfection with scramble siRNA, or with NUAK1- or NUAK2-specific siRNA. (E) Western blot analyses of WPMY-1 cells after transfection with scramble siRNA or siRNAs for NUAK1 or -2, with NUAK1 and -2 antibodies. Arrows indicate bands with sizes closest to expected molecular weights of NUAKs, which were densitometrically quantified. Shown are scatter plots containing single values from each examined sample (A–E), together with means (A,D,E), and with p values from Student’s t-test (A,E), Spearman correlation analyses (B), one-way ANOVA with Tukey’s test (D) or and together with Western blots including all analyzed tisses (C) or representing one representative out of a total of five independent experimts (E).

