FIGURE 6.
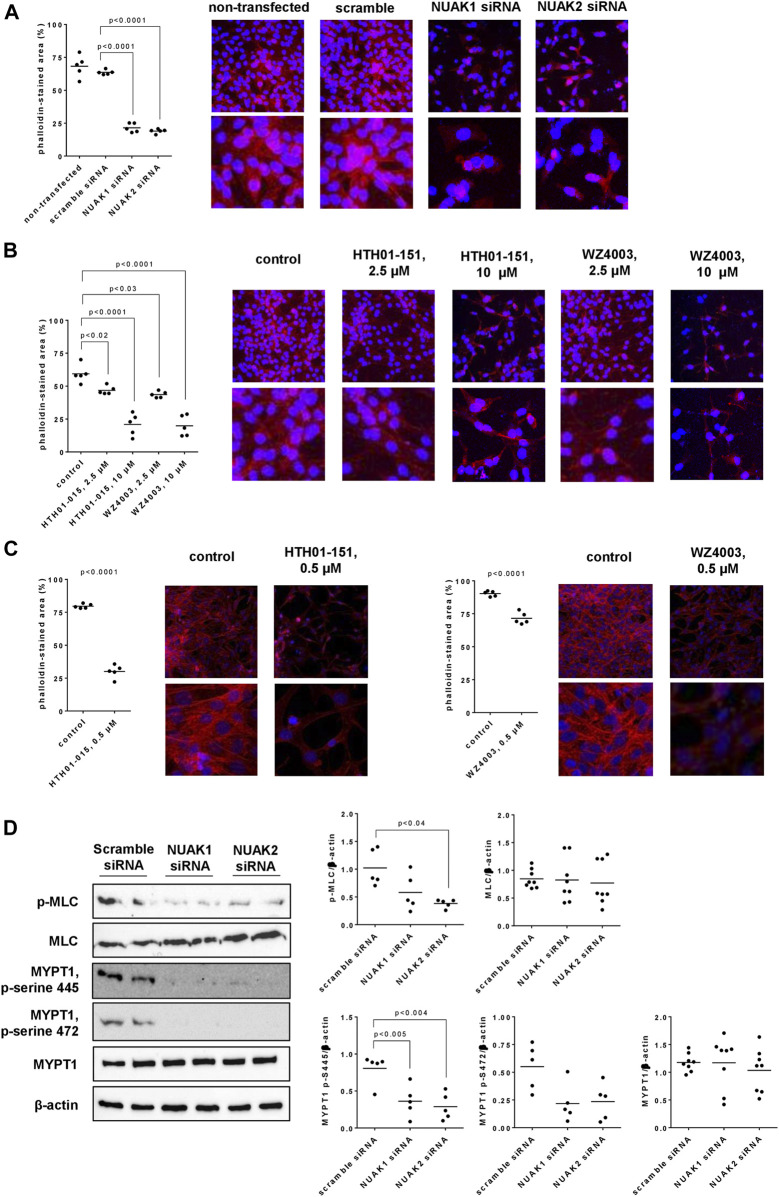
Actin organization and MLC phosphorylation in WPMY-1 cells. Actin organization was assessed by phalloidin staining (A–C), and levels of phospho-MLC, MLC, phospho-MYPT1 and MYPT1 were assessed by Western blot analyses (D). Phalloidin staining was performed 48 h after transfection with scramble siRNA or isoform-specific NUAK siRNAs (A), 24 h after addition of HTH01-015, WZ4003 or solvent to controls (B), or 48 h after addition of HTH01-015, WZ4003 or solvent to controls (C). Western blot analyses were performed with cells transfected with scramble siRNA or siRNAs for NUAK1 and -2 (D). Shown are scatter plots including all single values from quantification of each independent experiment together with p values from one-way ANOVA with Tukey’s test in (A), from one-way ANOVA with Dunnett’s test in (B), from Student’s t-test in (C), and from one-way ANOVA with Dunnett’s test in (D), and representative experiments from phalloidin staining (pictures in lower panels are cutouts from pictures in upper panels) and representative Western blots.

