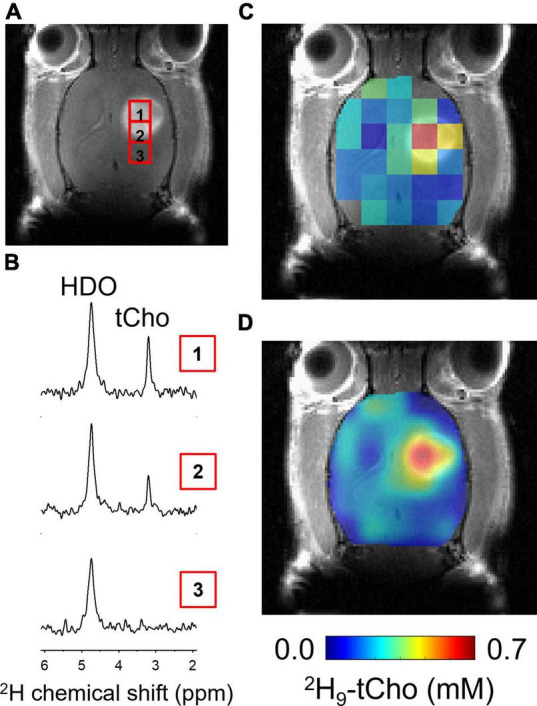
FIGURE 3.

In vivo DMI during infusion of 2H9-Cho. (A) Coronal slice of CE T1W MRI from brain of RG2-bearing rat, showing the tumor lesion and individual voxel positions selected from the 2H MRSI grid. (B) Individual 2H spectra from voxel positions indicated on MRI shown in panel (A). (C) Color-coded 2H MRSI grid overlaid on anatomical MRI. (D) Interpolated color-coded map based on data shown in panel (C). Color scale applies to both C and F. tCho, total choline; HDO, natural abundant 2H-labeled H2O.
