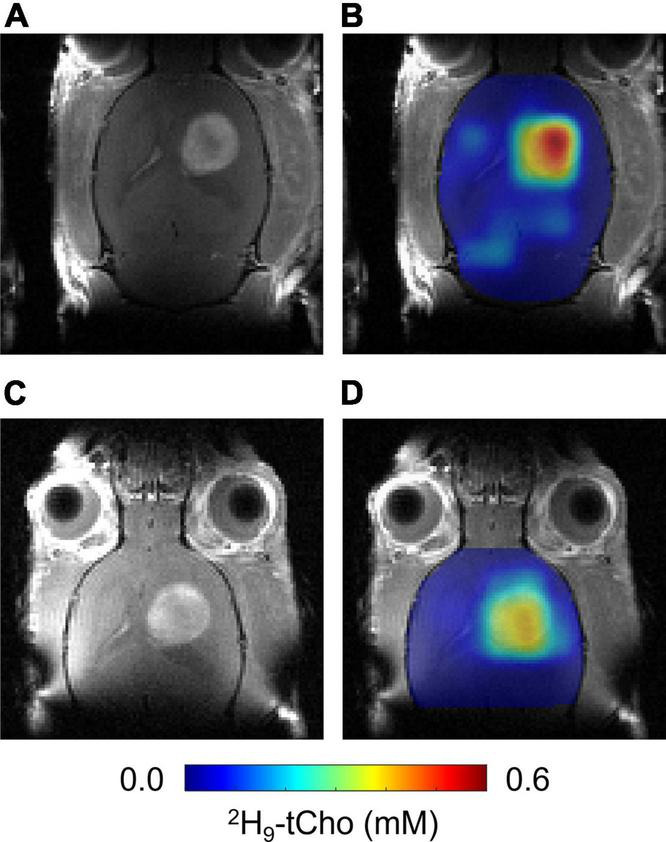
FIGURE 4.

In vivo DMI 24 h after infusion of 2H9-Cho. (A,C) CE T1W MRI of same RG2-bearing rat acquired before 36 min infusion of 2H9-Cho (A) and 24 h later (C). (B,D) Interpolated color-coded maps of 2H-tCho based on DMI data acquired during (B), and 24 h after (D) infusion of 2H9-Cho, in the same animal.
