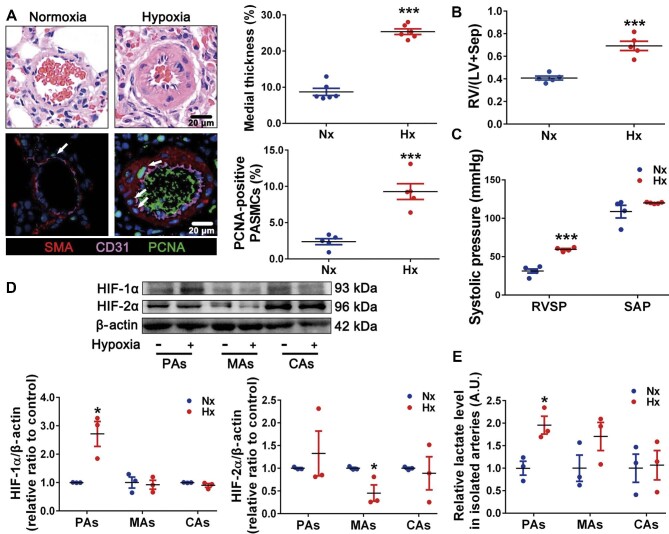
Figure 1.
The levels of HIF-1α and lactate are increased in remodeled PAs from hypoxic PH rats. (A) Top, representative H&E images of lung sections, with quantification of the ratio of medial thickness to diameter. Bottom, representative immunofluorescence images of lung sections stained for CD31 (pink), SMA (red), and PCNA (green, white arrows), with quantification of the percentage of PCNA-positive nuclei. Scale bar, 20 μm. (B) Changes in RV/(LV + Sep). (C) Changes in RVSP and SAP. (D) Immunoblots for HIF-1α, HIF-2α, and β-actin in isolated PAs, MAs, and CAs. (E) Relative lactate levels in freshly isolated PAs, MAs, and CAs. Data represent mean ± SEM; *P < 0.05, ***P < 0.001 vs. Nx; two-tailed unpaired Student's t-test. Nx, normoxia; Hx, hypoxia; A.U., arbitrary unit.

