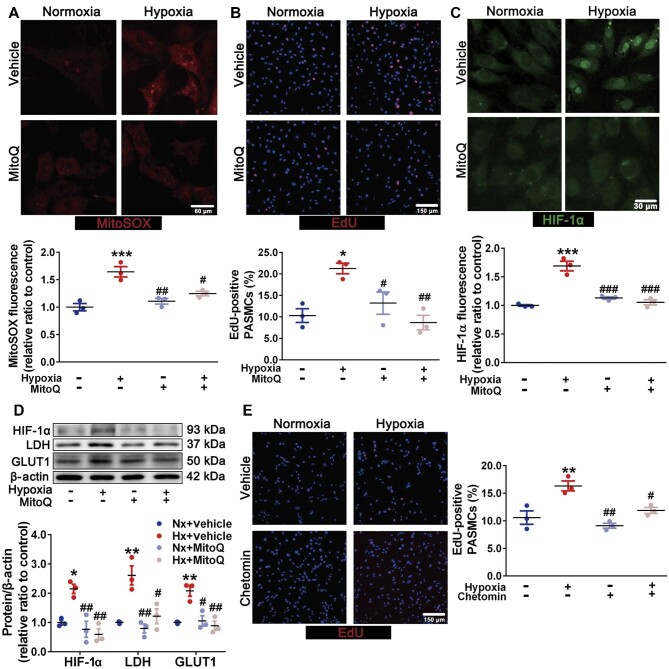
Figure 2.
Increased mROS facilitate PASMC proliferation in a HIF-1α-dependent manner. (A–D) Primary PASMCs were exposed to normoxia and hypoxia with or without MitoQ (0.5 μM) incubation. (A) Representative MitoSOX images of PASMCs (scale bar, 60 μm) with quantification of relative fluorescent density. (B) Representative EdU (red) images of PASMCs (scale bar, 150 μm) with quantification of the percentage of EdU-positive nuclei. (C) Representative immunofluorescence images of PASMCs stained for HIF-1α (scale bar, 30 μm) with quantification of the relative fluorescence density of HIF-1α. (D) Immunoblots for HIF-1α, GLUT1, LDH, and β-actin. (E) Representative EdU (red) images of PASMCs exposed to normoxia and hypoxia with or without 50 nM chetomin incubation, with quantification of the percentage of EdU-positive nuclei. Scale bar, 150 μm. Data represent mean ± SEM; *P < 0.05, **P < 0.01, ***P < 0.001 vs. Nx; #P < 0.05, ##P < 0.01, ###P < 0.001 vs. Hx; two-way ANOVA and Bonferroni's post-test.

