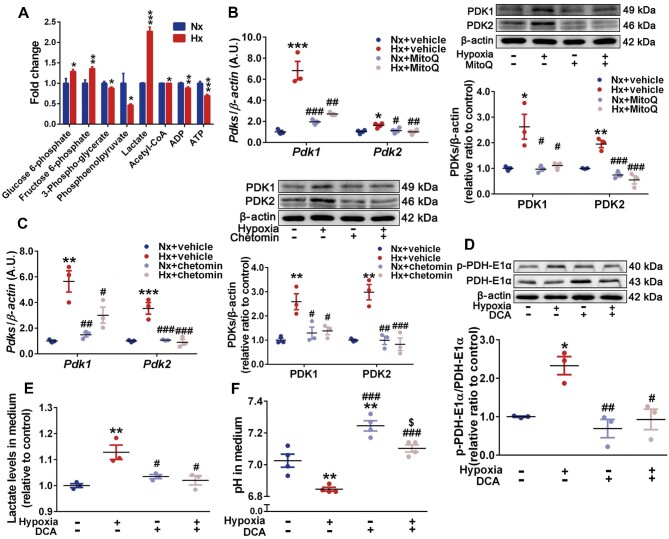
Figure 4.
HIF-1α-induced PDK1 and PDK2 promote PASMC glycolytic shift. (A) Significant fold changes of PASMC metabolites in the glycolytic pathway determined by targeted analysis via LC–MS/MS. (B and C) PASMCs were exposed to normoxia and hypoxia with or without MitoQ (0.5 μM, B)/chetomin (50 nM, C) incubation. Left, mRNA levels of Pdk1 and Pdk2 relative to β-actin determined by RT-qPCR. Right, immunoblots for PDK1, PDK2, and β-actin. (D–F) PASMCs were exposed to normoxia and hypoxia with or without DCA (10 mM) incubation. (D) Immunoblots for p-PDH-E1α, total PDH-E1α, and β-actin, with quantification of the ratio of p-PDH-E1α to total PDH-E1α. (E and F) Relative lactate concentrations (E) and pH (F) in PASMC culture medium. Data represent mean ± SEM; *P < 0.05, **P < 0.01, ***P < 0.001 vs. Nx; #P < 0.05, ##P < 0.01, ###P < 0.001 vs. Hx; two-tailed unpaired Student's t-test (A) or two-way ANOVA and Bonferroni's post-test (B–F).

