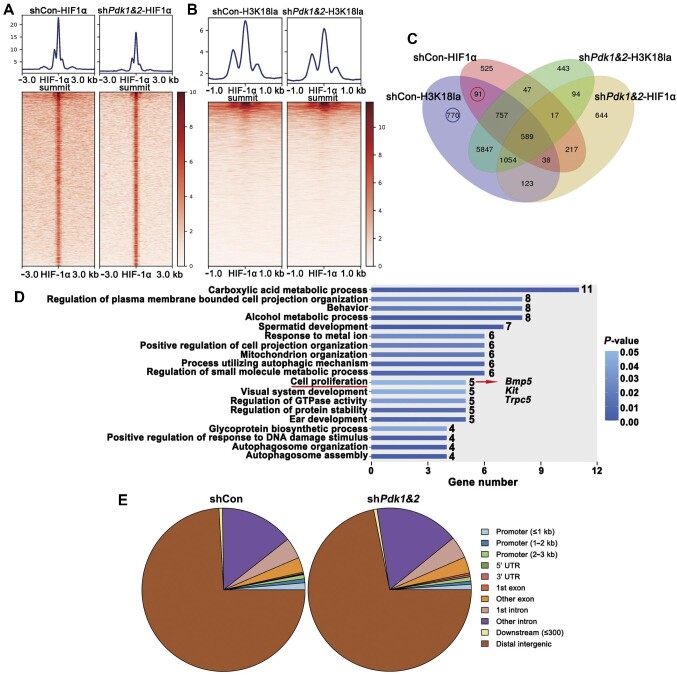
Figure 6.
PDK1 and PDK2-dependent histone lactylation of HIF-1α targets associated with cell proliferation. (A) Peak plots of HIF-1α ChIP–seq ± 3 kb around HIF-1α summit. (B) Heatmaps of H3K18la density ± 1 kb around the HIF-1α peaks. (C) Venn diagram of genes from HIF-1α and H3K18la ChIP–seq peaks with shCon vs. shPdk1&2. (D) Red-circled 91 genes in venn diagram were picked for GO enrichment analysis. P < 0.05 was set as the threshold of significance. (E) Distribution of HIF-1α peaks in the genome.

