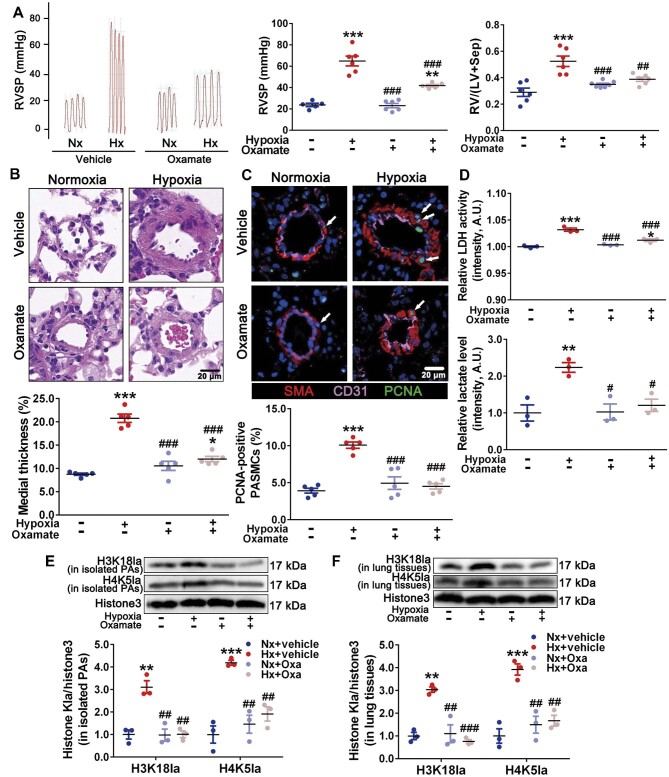
Figure 7.
Inhibition of LDH attenuates histone lactylation as well as PH and PAs remodeling in hypoxic PH model. (A) Representative images of tracing of RVSP (left), with quantification (middle). Changes in RV/(LV + Sep) (right). (B) Representative H&E images of lung sections, with quantification of the ratio of medial thickness to diameter. Scale bar, 20 μm. (C) Representative immunofluorescence images of lung sections stained for CD31 (pink), SMA (red), and PCNA (green, white arrows), with quantification of the percentage of PCNA-positive nuclei. Scale bar, 20 μm. (D) Relative levels of LDH activity (top) and lactate (bottom) in freshly isolated PAs. (E and F) Immunoblots for H3K18la, H4K5la, and histone H3 in isolated PAs (E) and lung tissues (F). Data represent mean ± SEM; *P < 0.05, **P < 0.01, ***P < 0.001 vs. Nx; #P < 0.05, ##P < 0.01, ###P < 0.001 vs. Hx; two-way ANOVA and Bonferroni's post-test.

