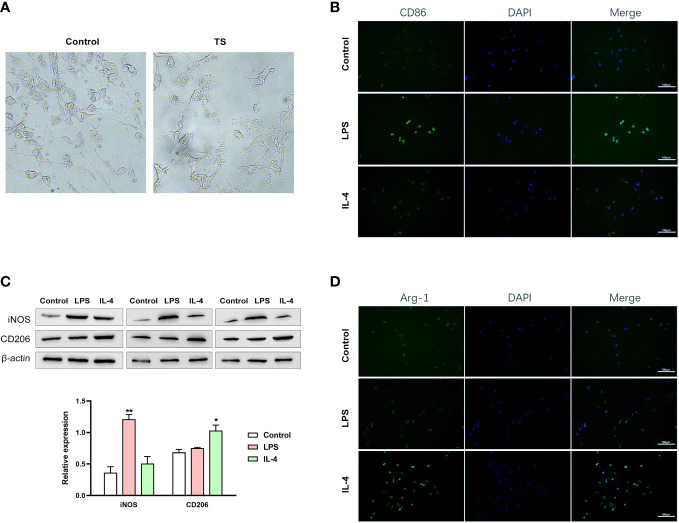
Figure 3.
Different groups of microglia. (A) The morphology of microglia in two groups. (B–D) Normal microglia are treated using lipopolysaccharide (LPS) (towards the M1 phenotype) or IL-4 (towards the M2 phenotype). (B) LPS treatment effectively induced a M1 polarization of microglia (verified by the IF of the marker CD86). (C) IL-4 triggered a M2 polarization (verified by the IF of the marker Arg-1). (D) Western blot analysis of iNOS and CD206 expression in two treatment groups. *P <0.05, **P <0.01.

